
Original 2011 deck · 36 slides. Click a thumbnail or scroll down for the full breakdown.
Moz
Rand Fishkin's July 2011 SEOmoz deck is one of the most studied B2B SaaS pitches ever, a 36-slide memoir that raised ~$18M by telling a 30-year origin story before asking for growth capital. It pairs inbound-marketing proof with unusually honest unit economics and a full risk section.
Original 2011 deck · 36 slides. Click a thumbnail or scroll down for the full breakdown.
The Next Stage of Moz, from Mom + Son consultancy to world SEO software leader and Seattle's next $1B company. Rand Fishkin, July 2011.
The subtitle reads like a memoir chapter, not a tagline. Investors know immediately this is a story-driven deck from a founder who has already built something real.
Color timeline from 1981 (Gillian founds the company) through July 2011, blog launch, $39/mo PRO, $1.1M Series A, Linkscape, tiered pricing, Moz.com acquisition.
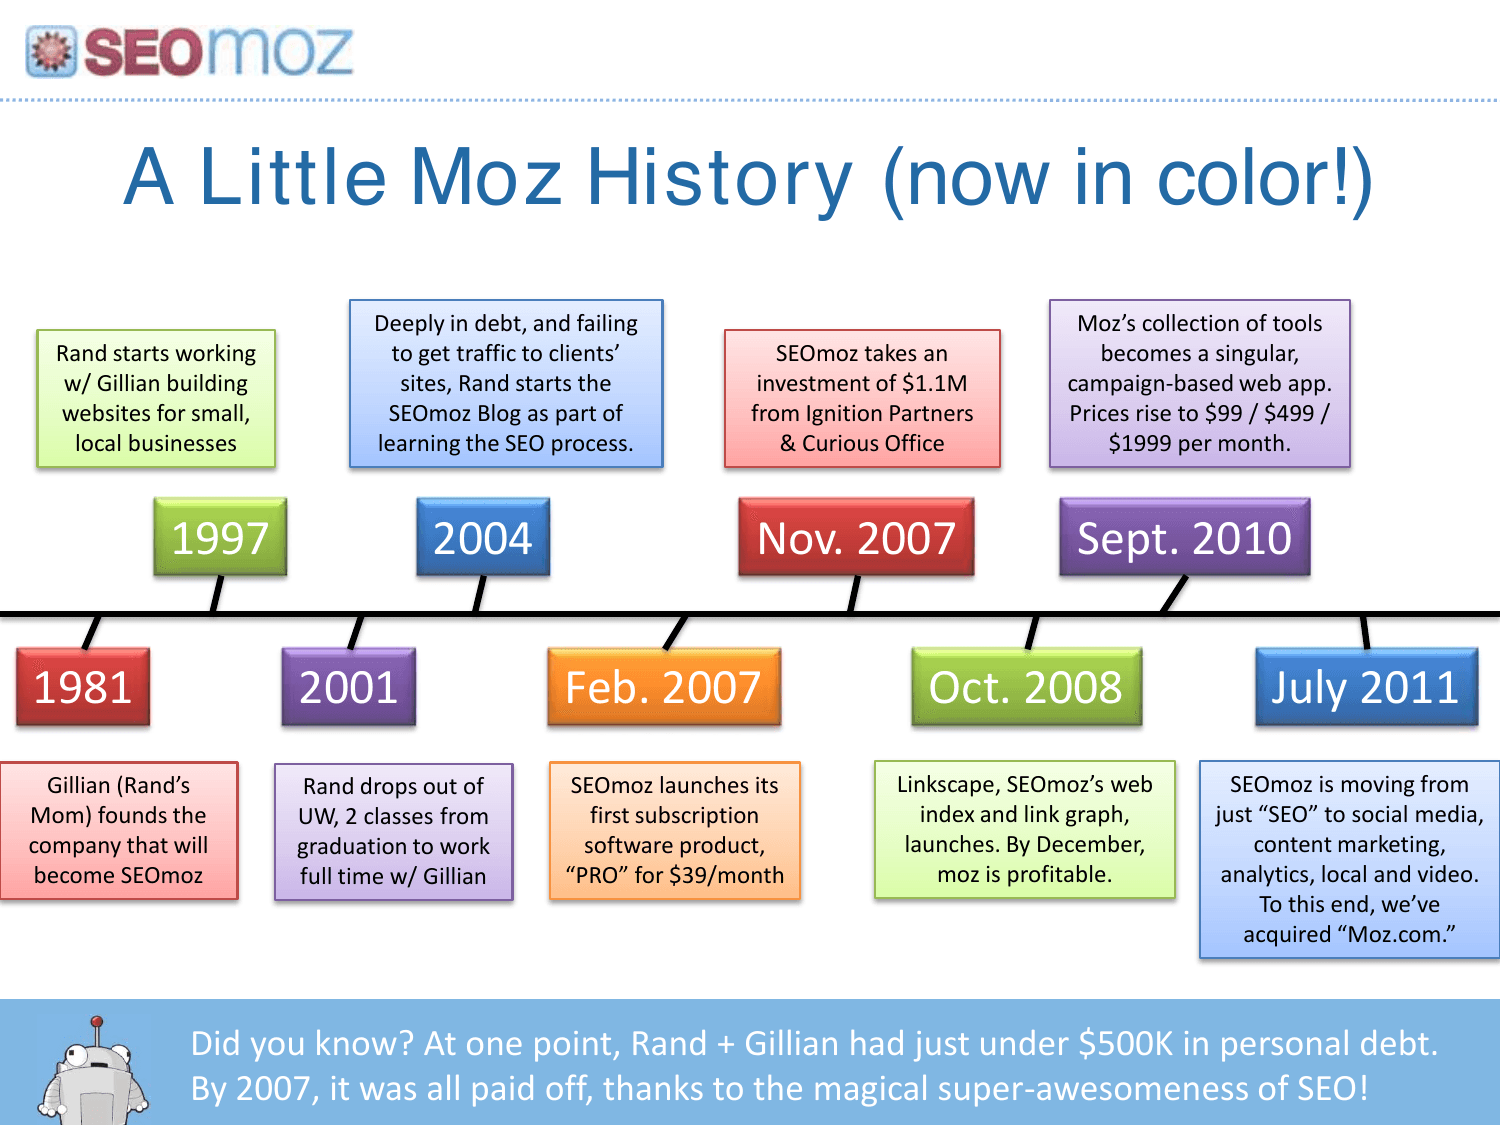
Thirty years on one slide replaces a team-credentials page. The footnote about paying off $500K personal debt adds founder authenticity investors remember.
Dual-axis chart: software revenue grows from $400K (2007) to $12.5M (2011) while consulting fades; monthly visits hit 1.25M. Callouts note the 2007 raise, 2009 consulting exit, 10K+ subscribers, and 83%+ margins.
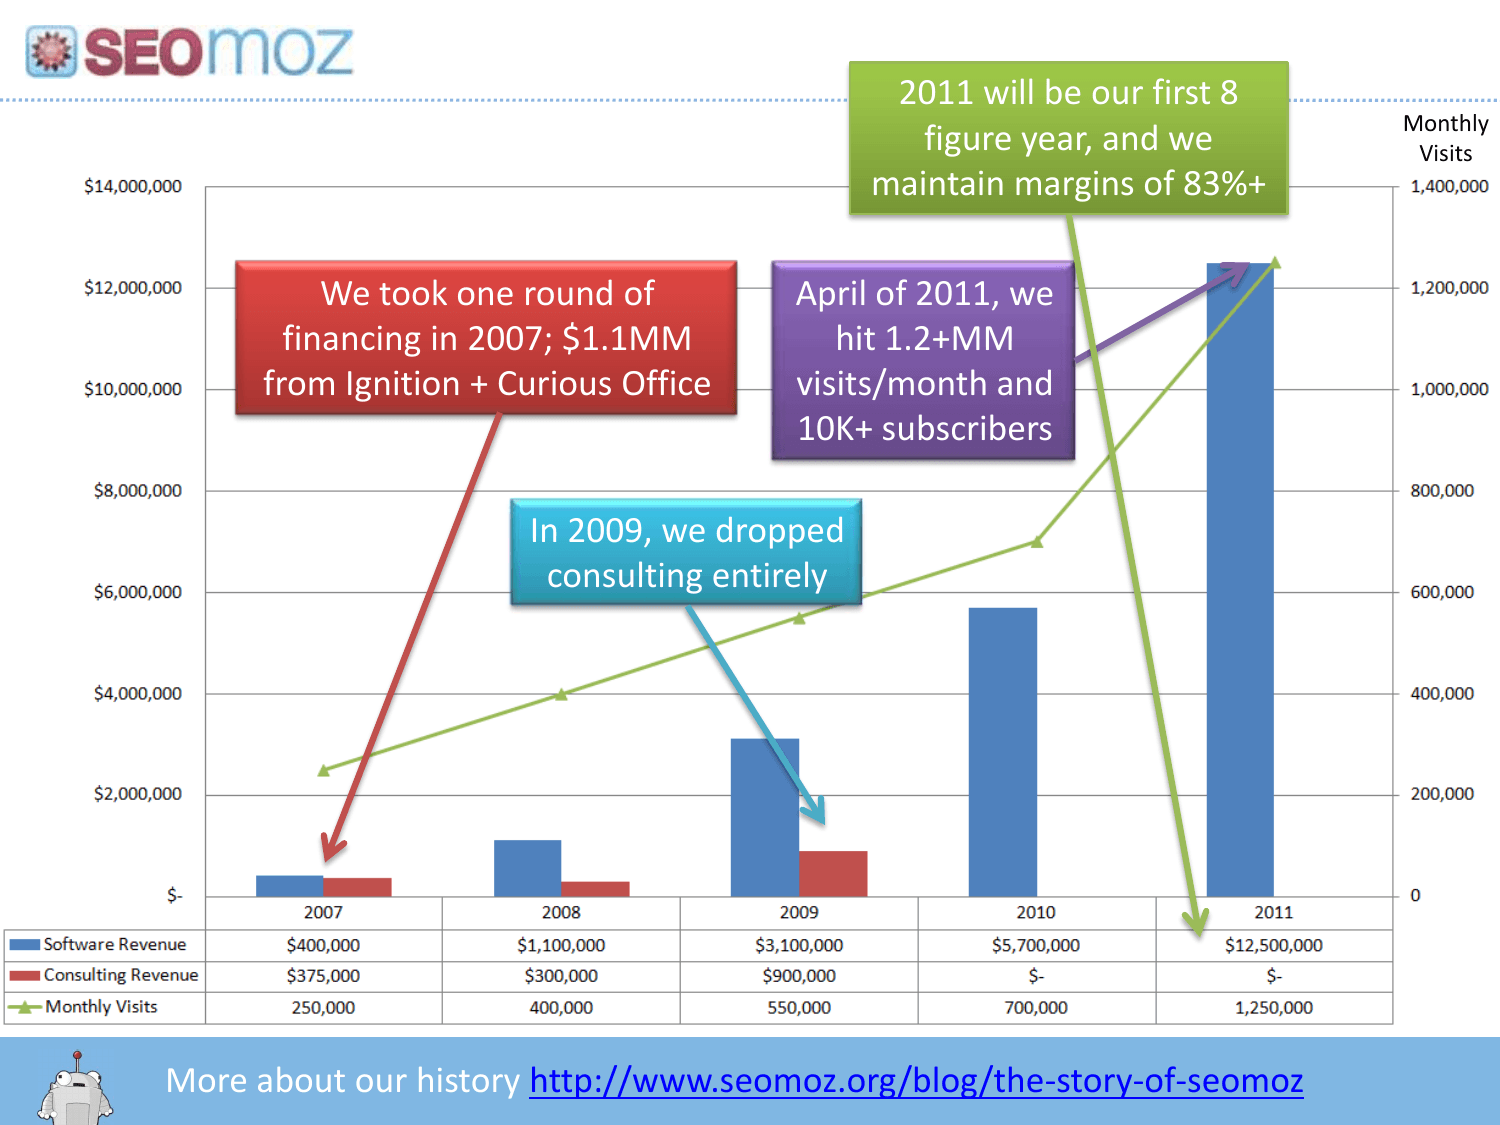
Annotated financing beats a bullet list, each capital event gets context. Showing the consulting-to-SaaS pivot in one chart proves the business model shift worked.
Roger MozBot asks the rhetorical question in a speech bubble, a section divider before the growth strategy.
A single question slide resets attention after heavy data. Founders with long decks need these breathing-room transitions.
Eighteen traffic sources, blogs, SEO, social, PR, webinars, infographics, all arrow into 'INBOUND MARKETING.' Footer: zero paid customer acquisition until 2010.
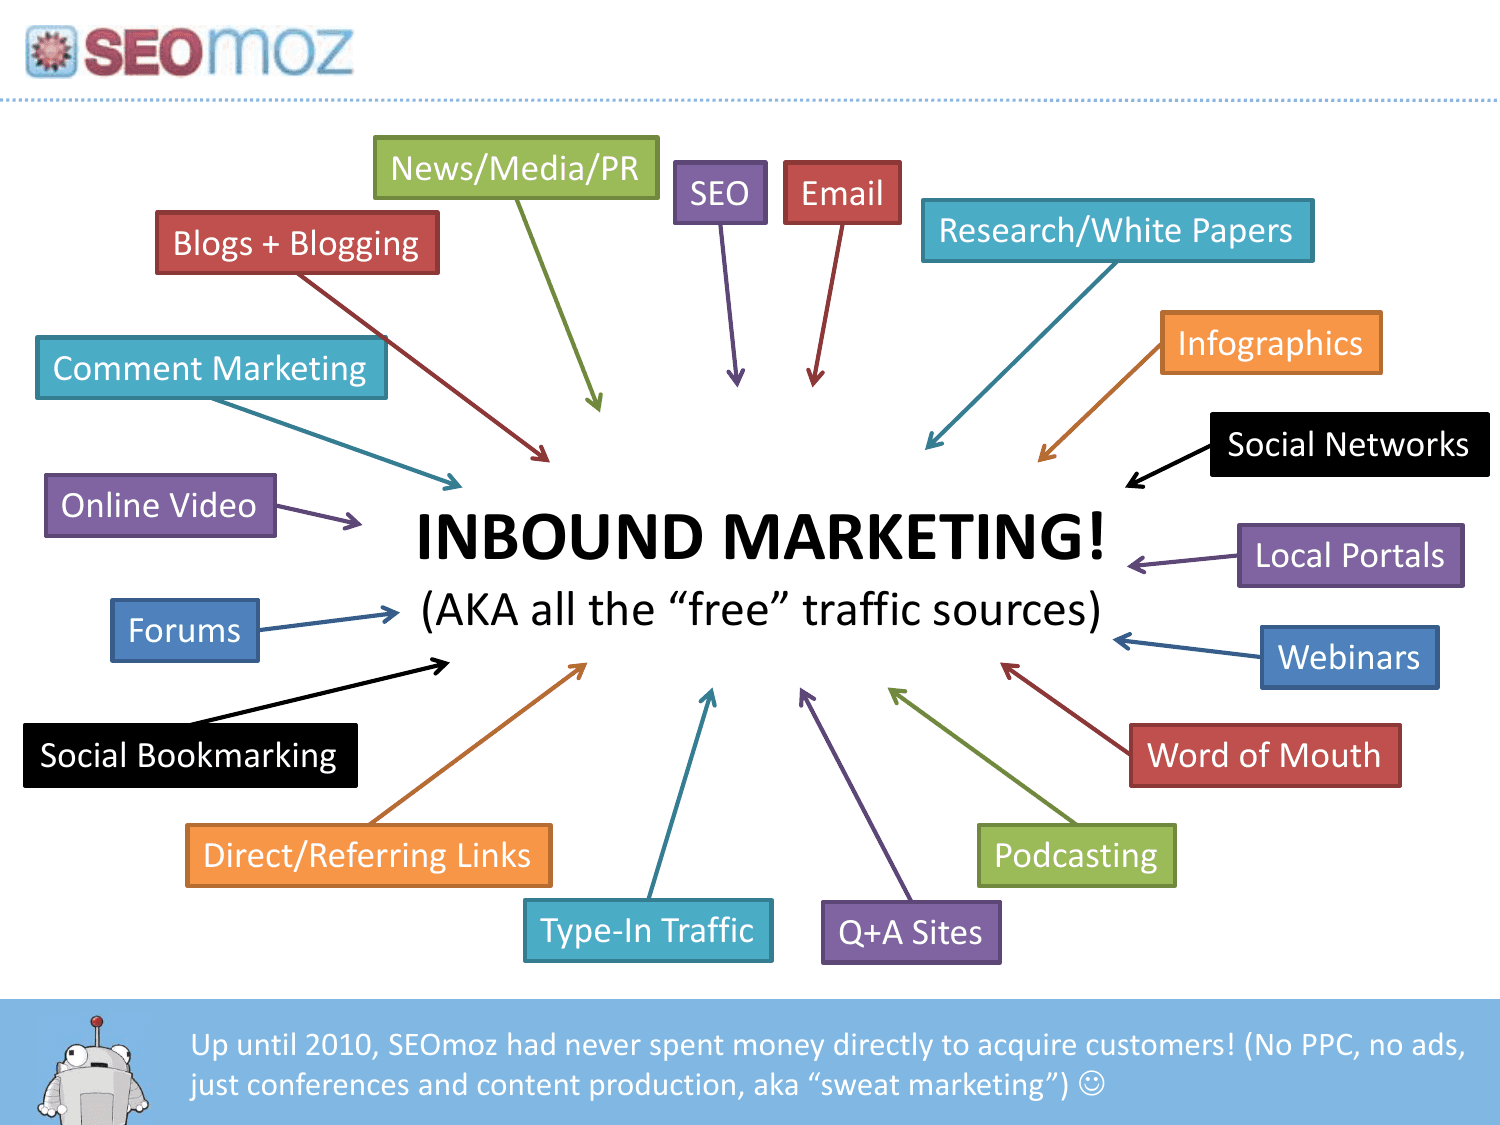
Moz literally demos its GTM on a slide. Claiming years without PPC while pitching an SEO company is the strongest possible social proof.
That's what we want to help other companies measure and improve through our cloud-based software.
Bridges inbound philosophy to the product ask in one sentence. Keeps the narrative flowing instead of jumping straight to feature screenshots.
Section header: Macroeconomic Trends that Benefit Moz.

Signals a shift from company story to market tailwinds. Section dividers with consistent Roger branding make 36 slides feel structured.
FTI Consulting stacked-bar chart: total ad spend by media 2007–2014, with internet share growing while newspapers shrink.
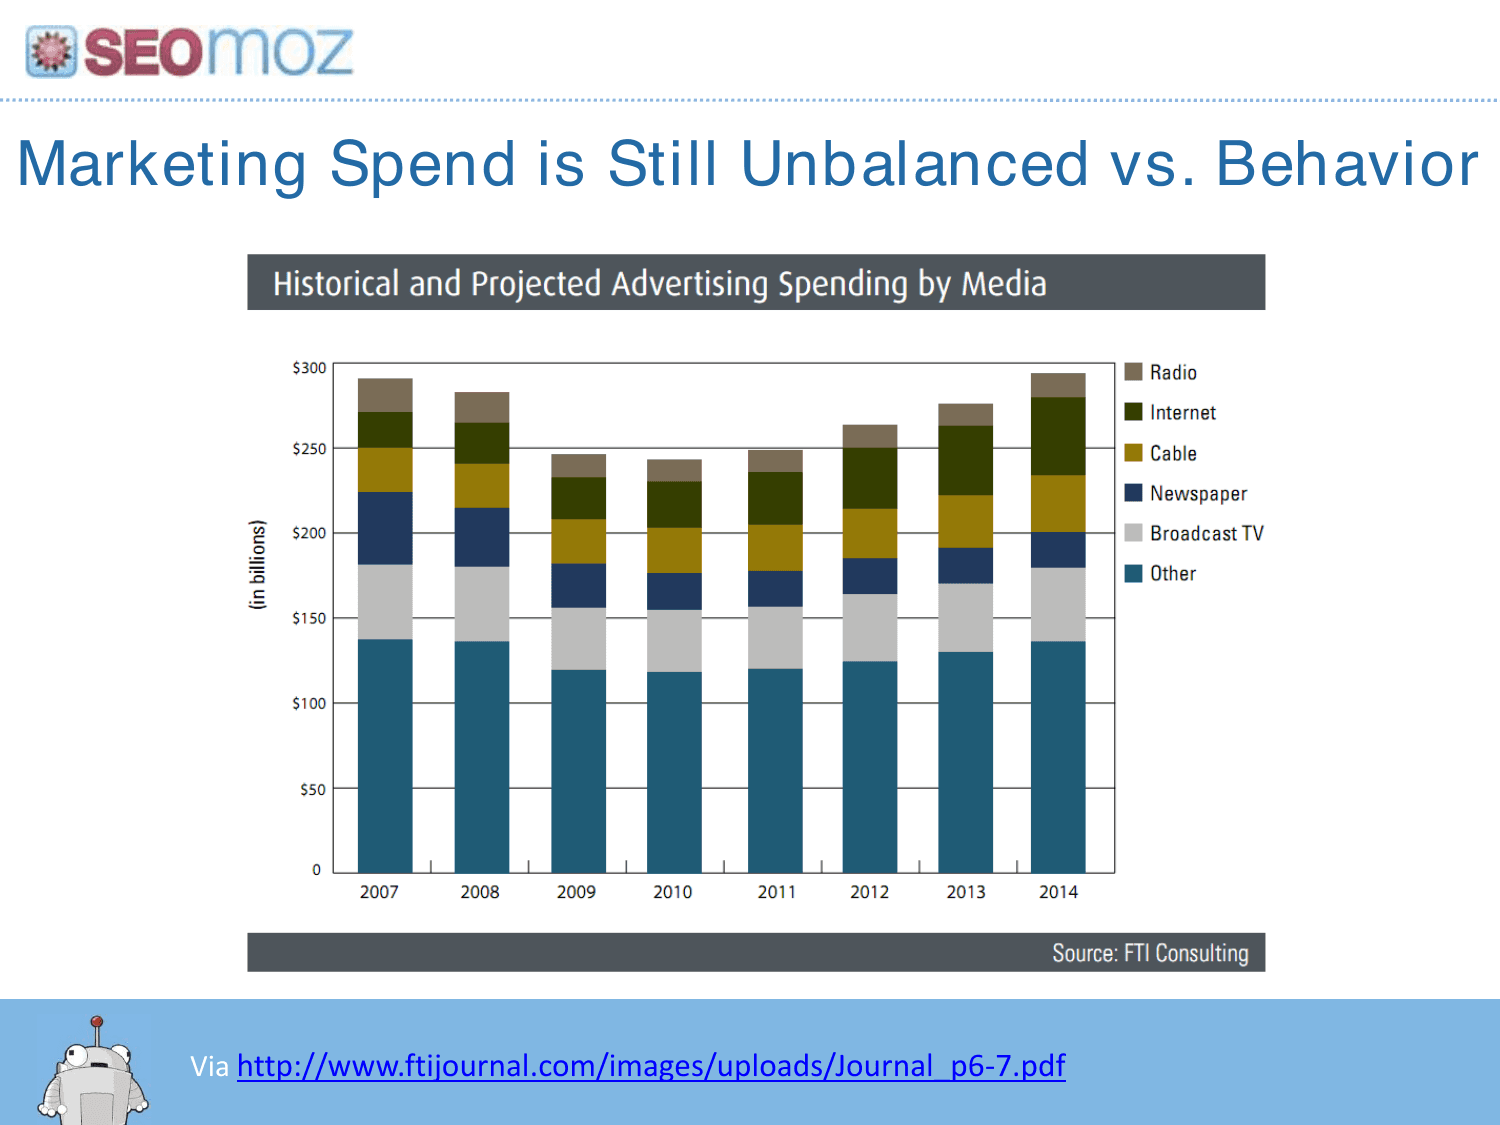
Third-party data anchors the macro thesis. Citing FTI Consulting gives investors a source they can verify, not founder opinion.
Pie chart of web traffic sources: organic drives 90%+ of traffic on ~$5B spend; paid drives under 10% on $31B+.
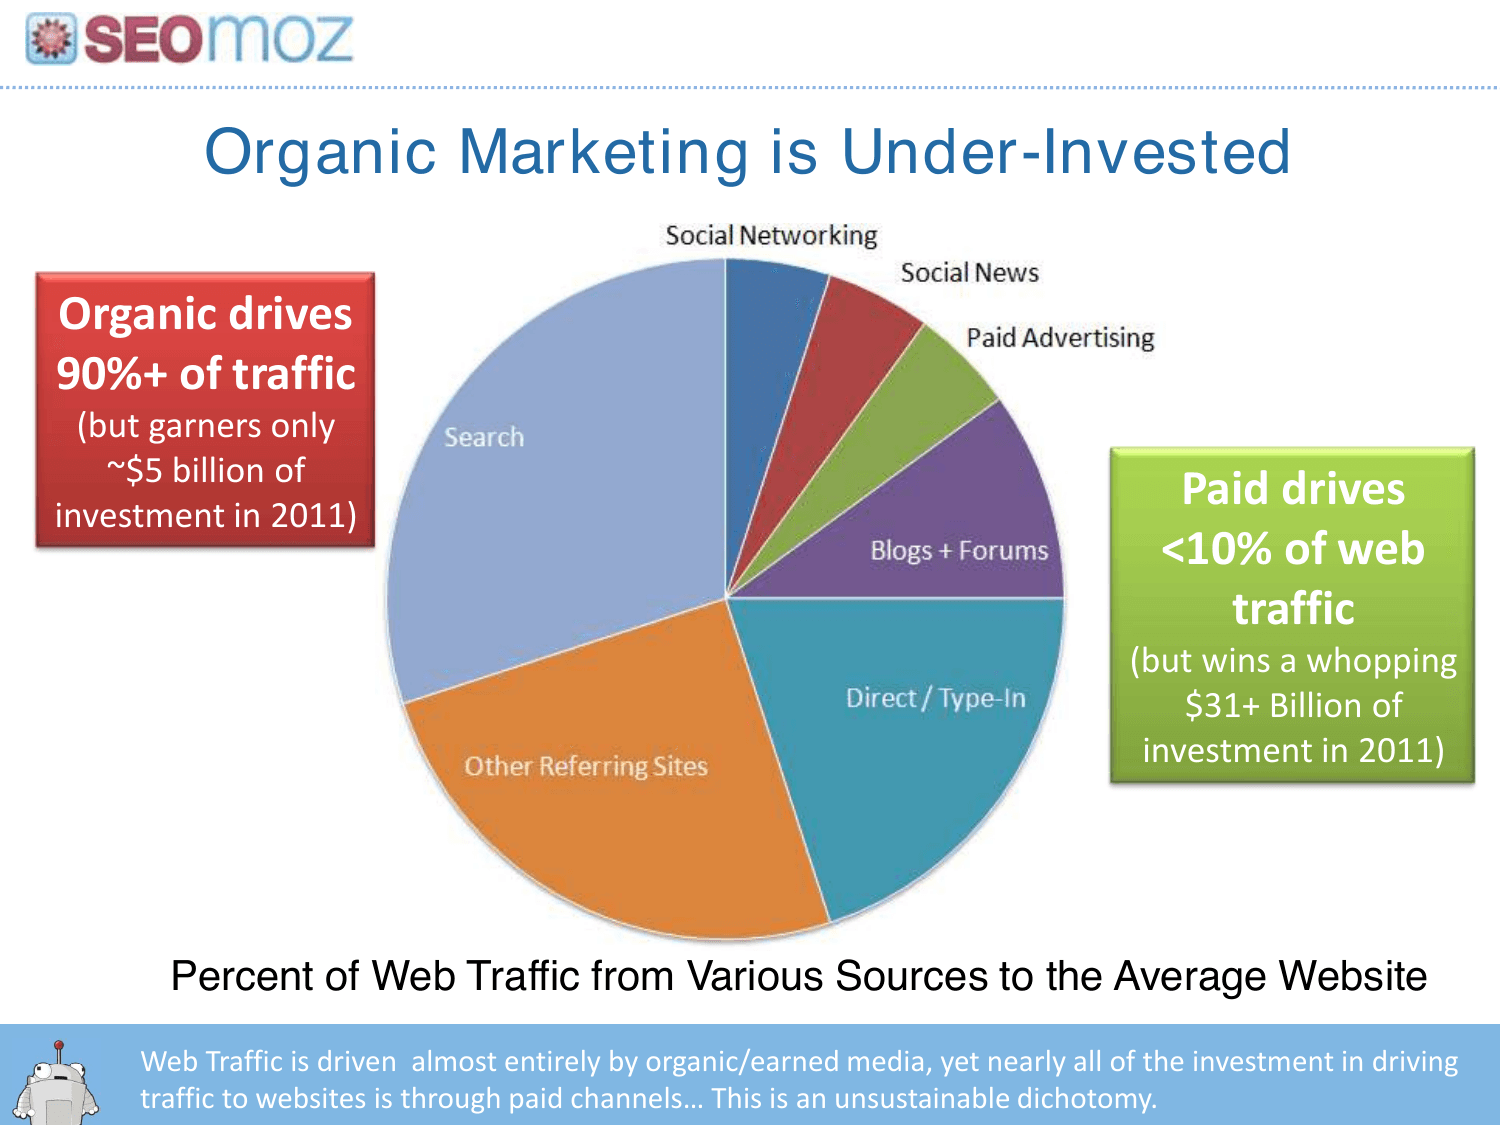
The organic-vs-paid spend gap is Moz's entire market thesis in one visual. Red/green callouts make the inefficiency impossible to miss.
Three personas. Executives ('Do more with less'), Marketing Managers ('Free traffic only scales with people'), Web Marketers ('Right tools + data = work of 10').
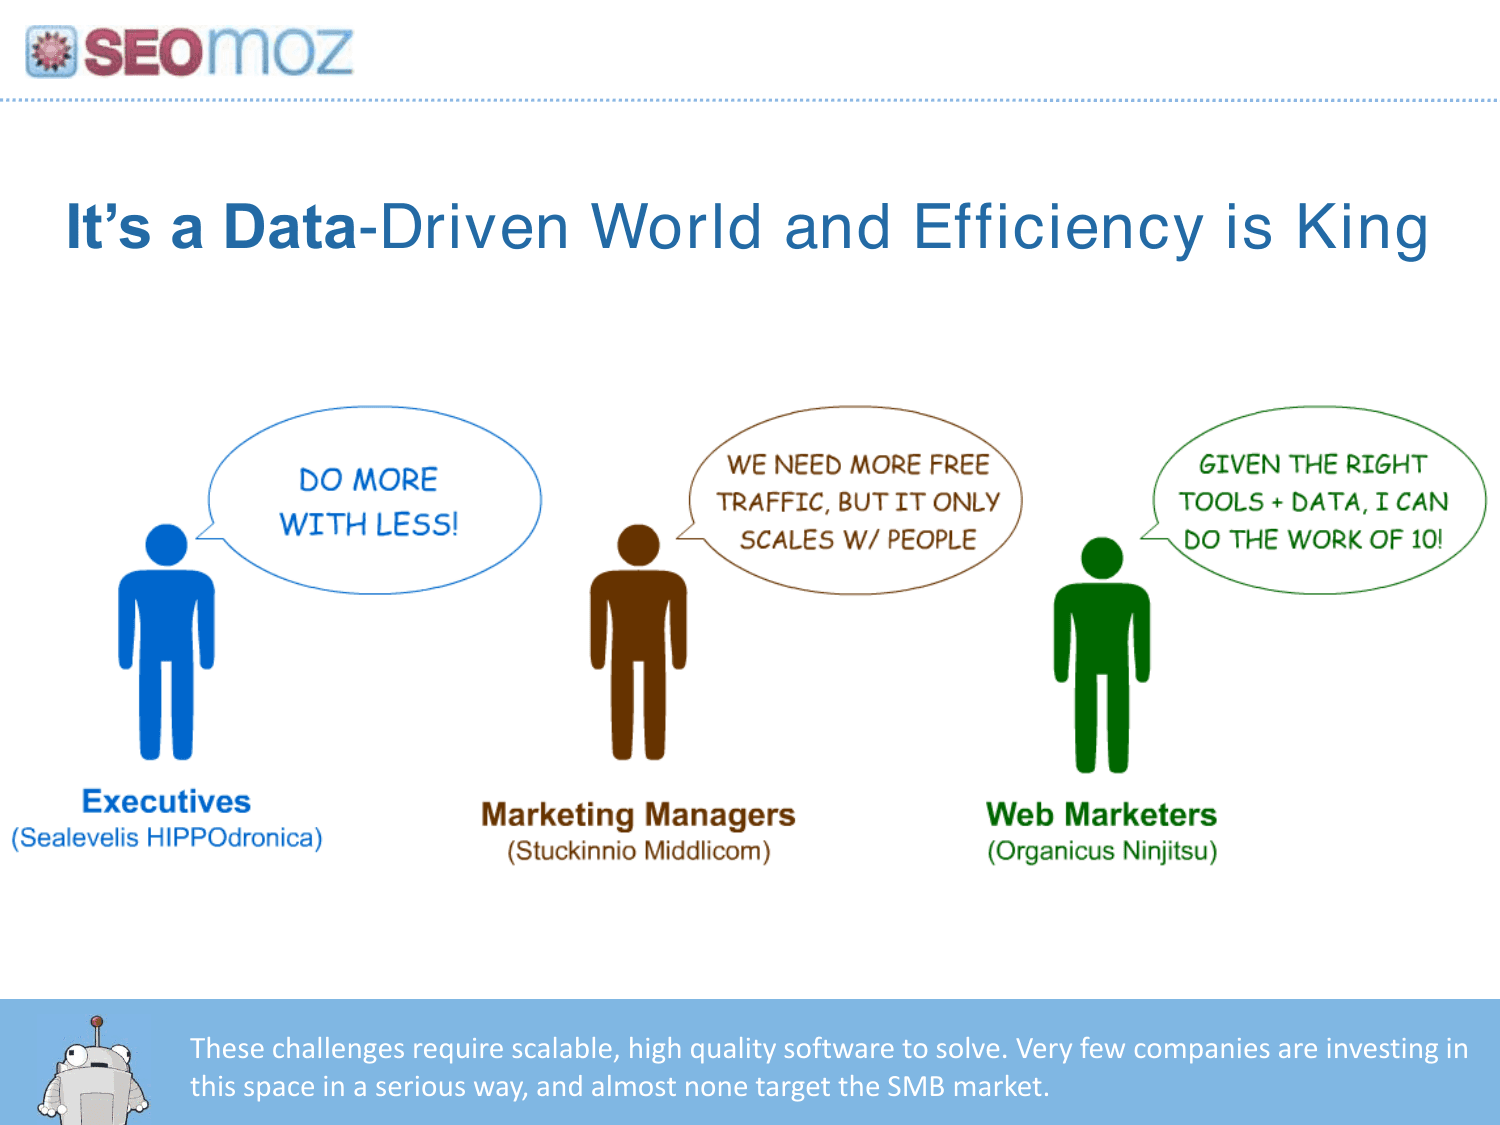
Persona slides with humor (Sealevelis HIPPOdronica) keep B2B copy human. Each stakeholder's pain maps to a software scalability problem.
Section divider introducing the problem framing.
After macro trends, this pivot says 'here's what we actually sell against.' Clear problem sections help investors track the narrative arc.
Four-step loop: invest in content/search/social → measure ROI → reinvest in winners → earn outsized rewards vs paid channels.
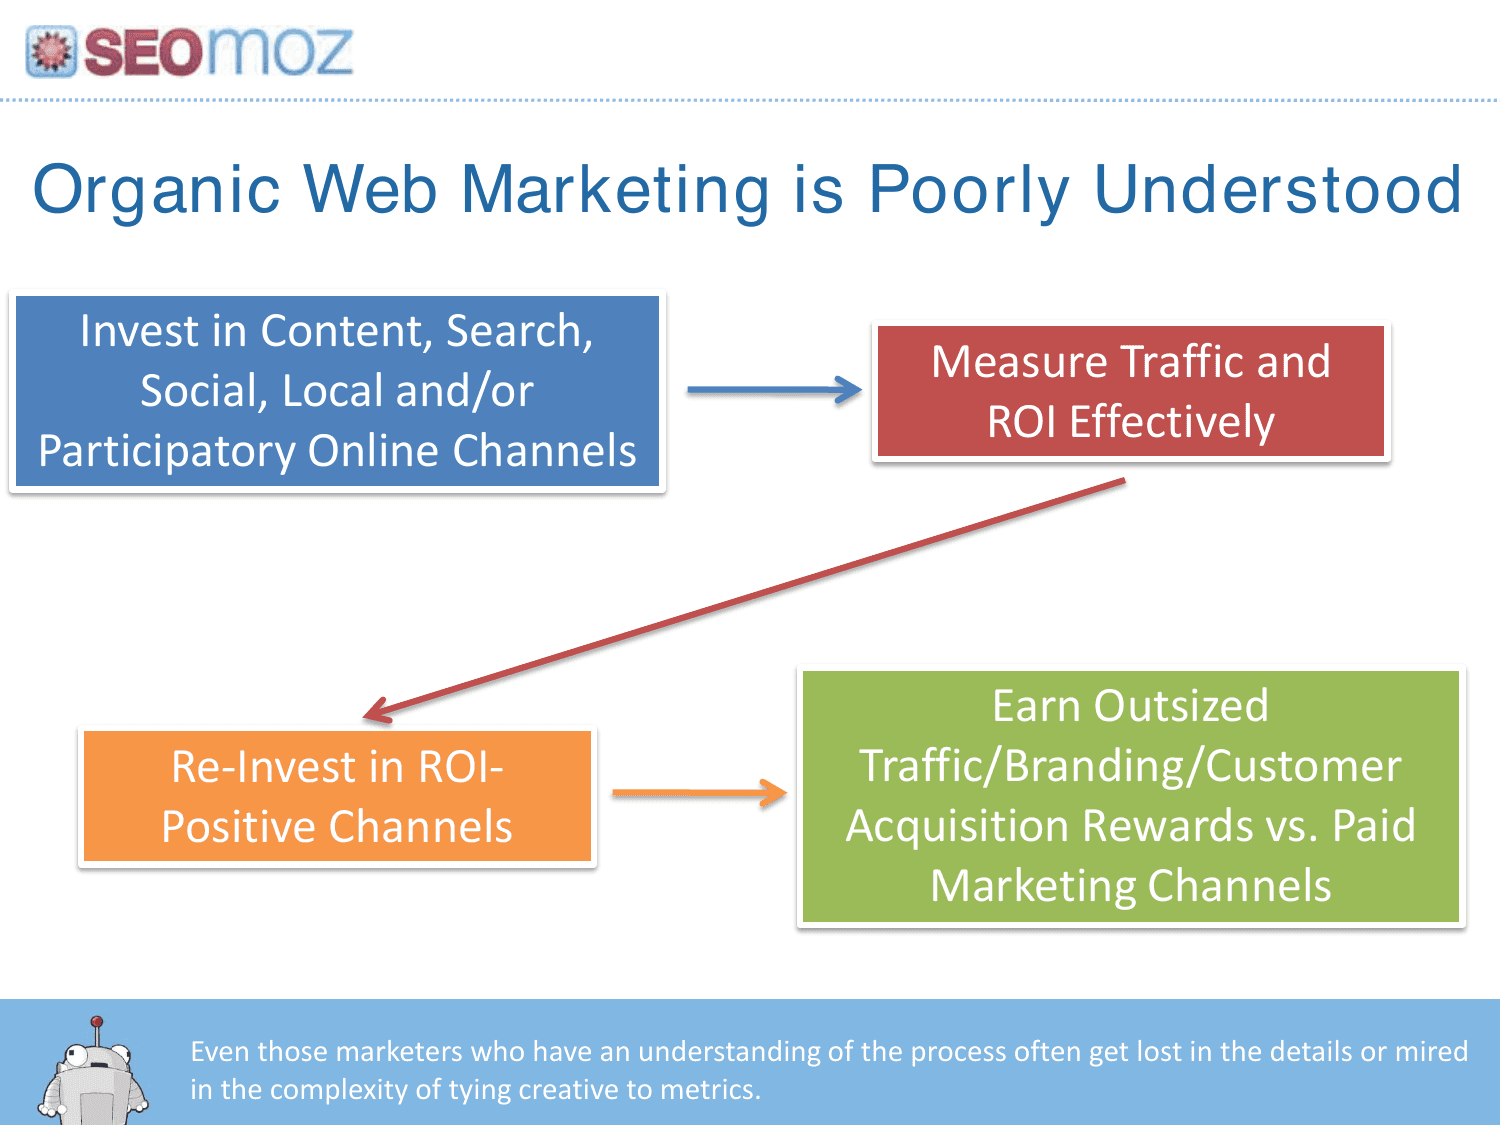
Teaches the category before selling the product. Investors learn the playbook Moz automates, classic category-creation pitching.
Marketers log into 10+ tools weekly. Google Analytics, Facebook, Twitter, Webmaster Tools, Bit.ly, and more, tiered by how many use each.
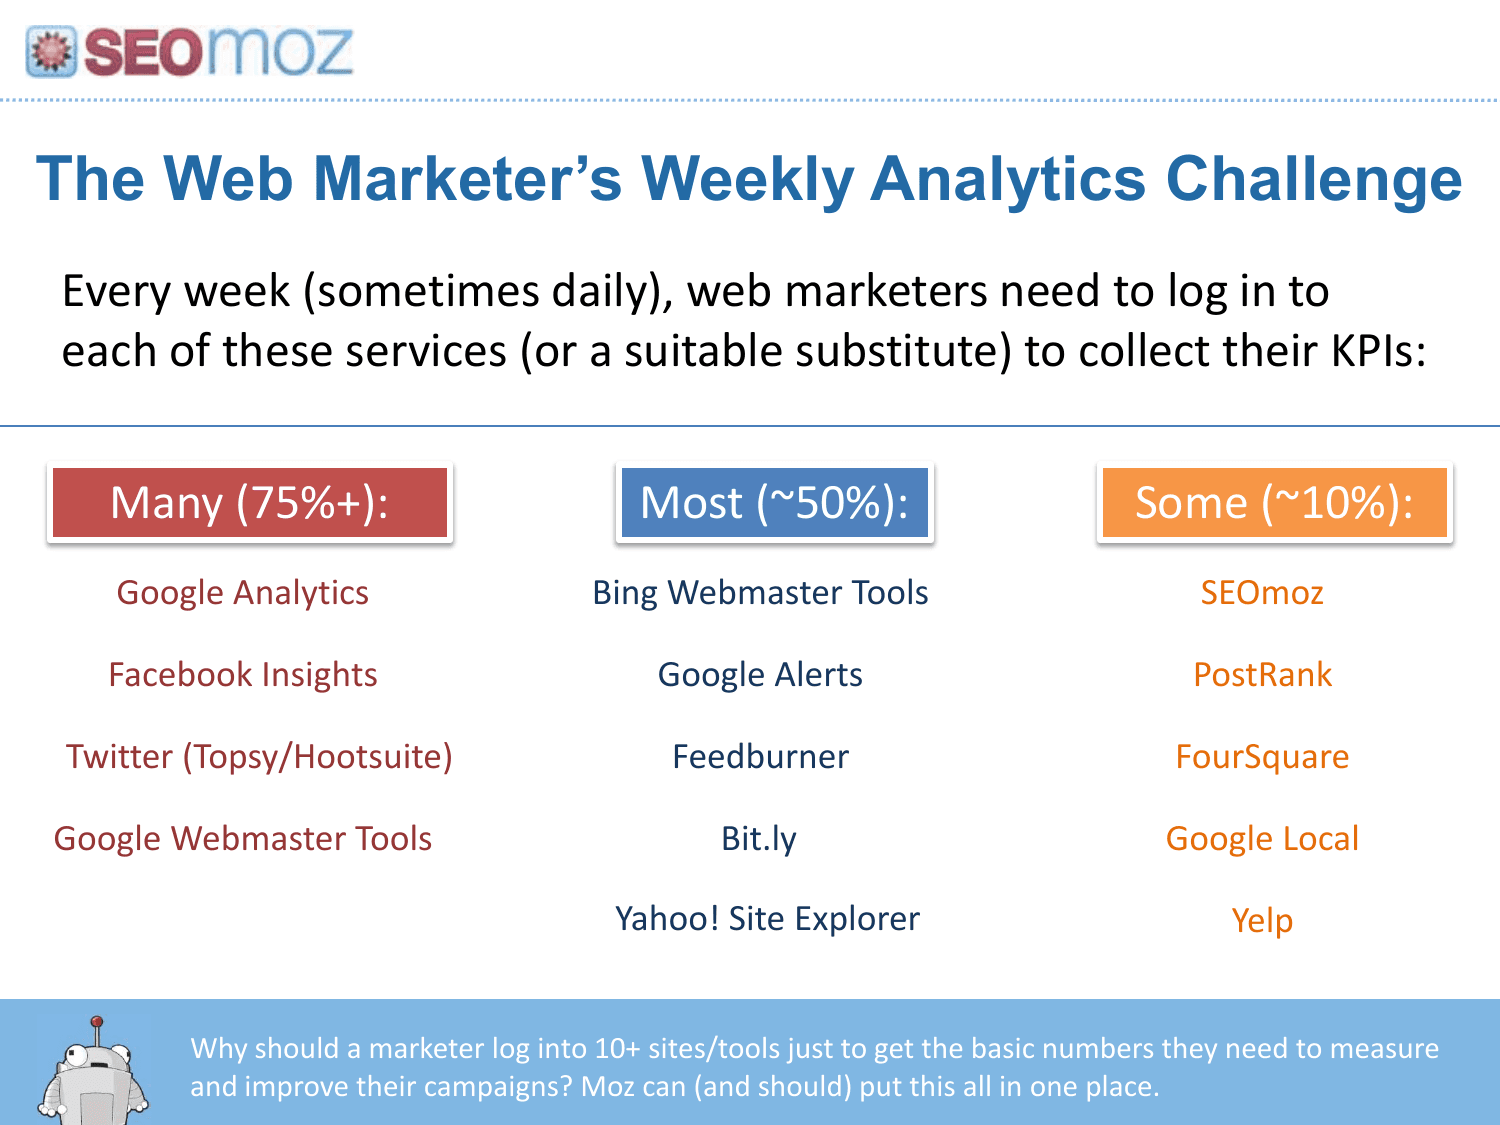
Named tools make the fragmentation pain concrete. The closing line, put it all in one place, is the product thesis without a screenshot.
Six manual jobs: researching opportunities, finding high-ROI channels, prioritizing tasks, finding errors, optimizing channels, training new marketers.
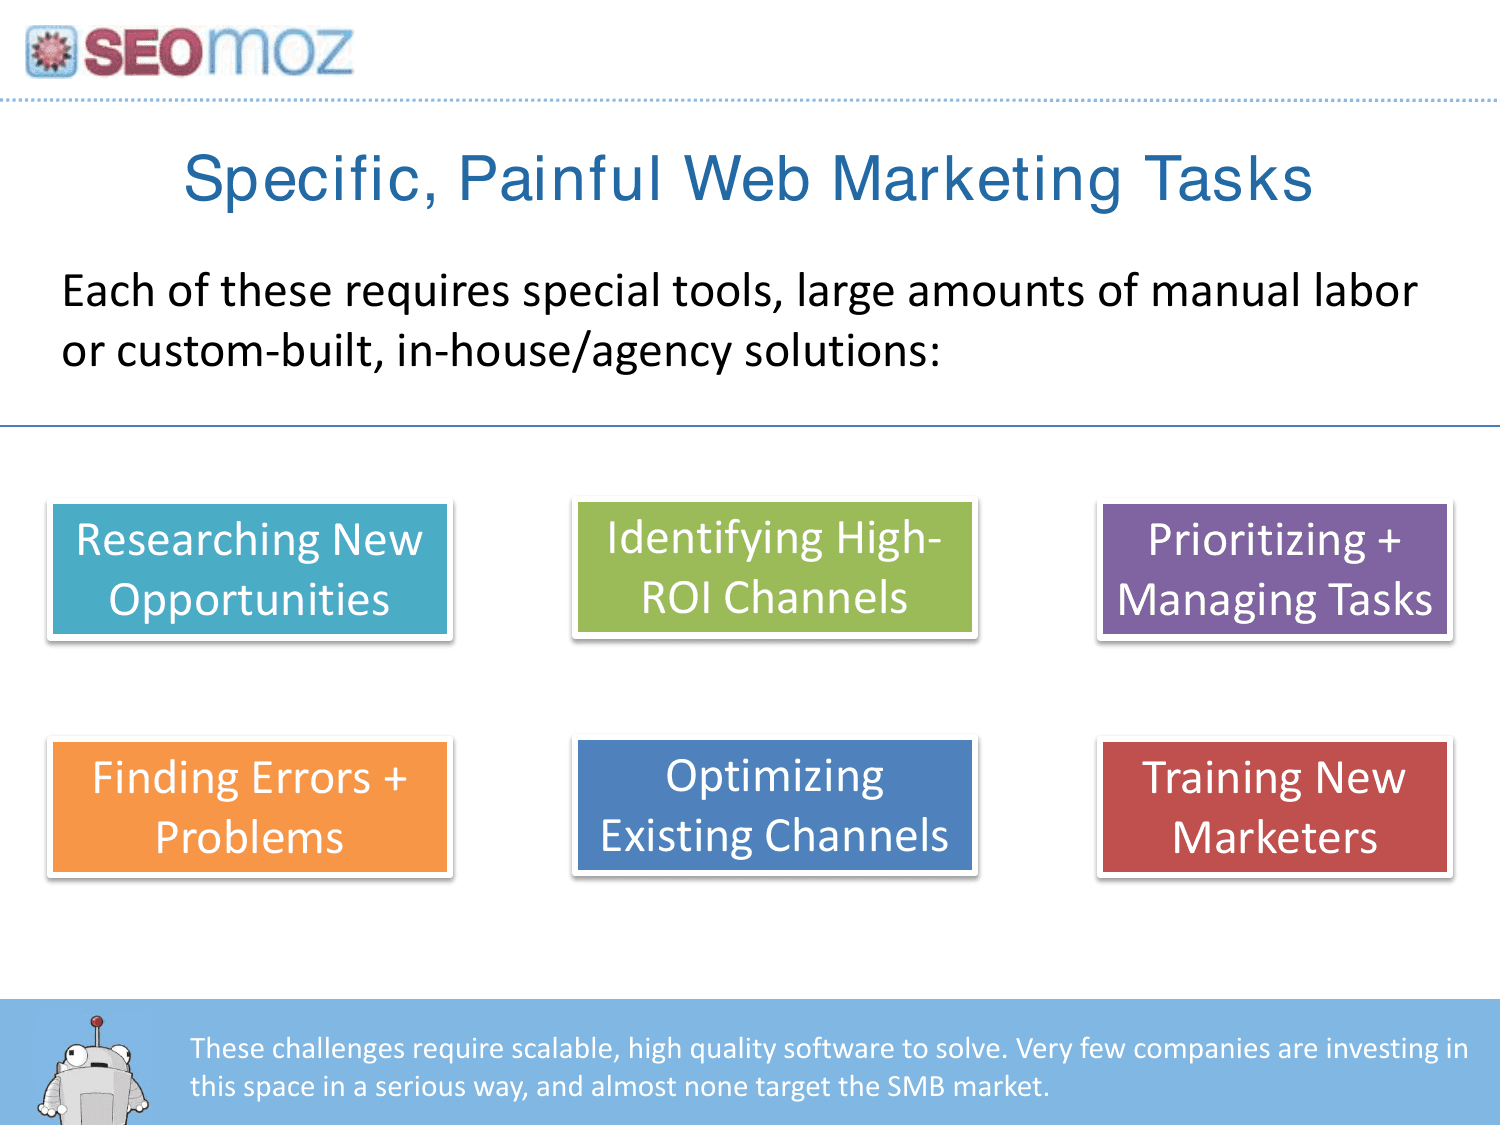
Grid layout turns abstract 'SEO is hard' into six billable workflows. Positions Moz as horizontal marketing ops software, not a single-feature tool.
Section divider before market segmentation slides.

Another clean break before TAM-style content. Long decks need explicit chapter markers so investors don't get lost.
Overlapping circles for SEO, inbound, bloggers, agencies, SMB owners, and more. Moz has captured 5–10% of just the two SEO circles.
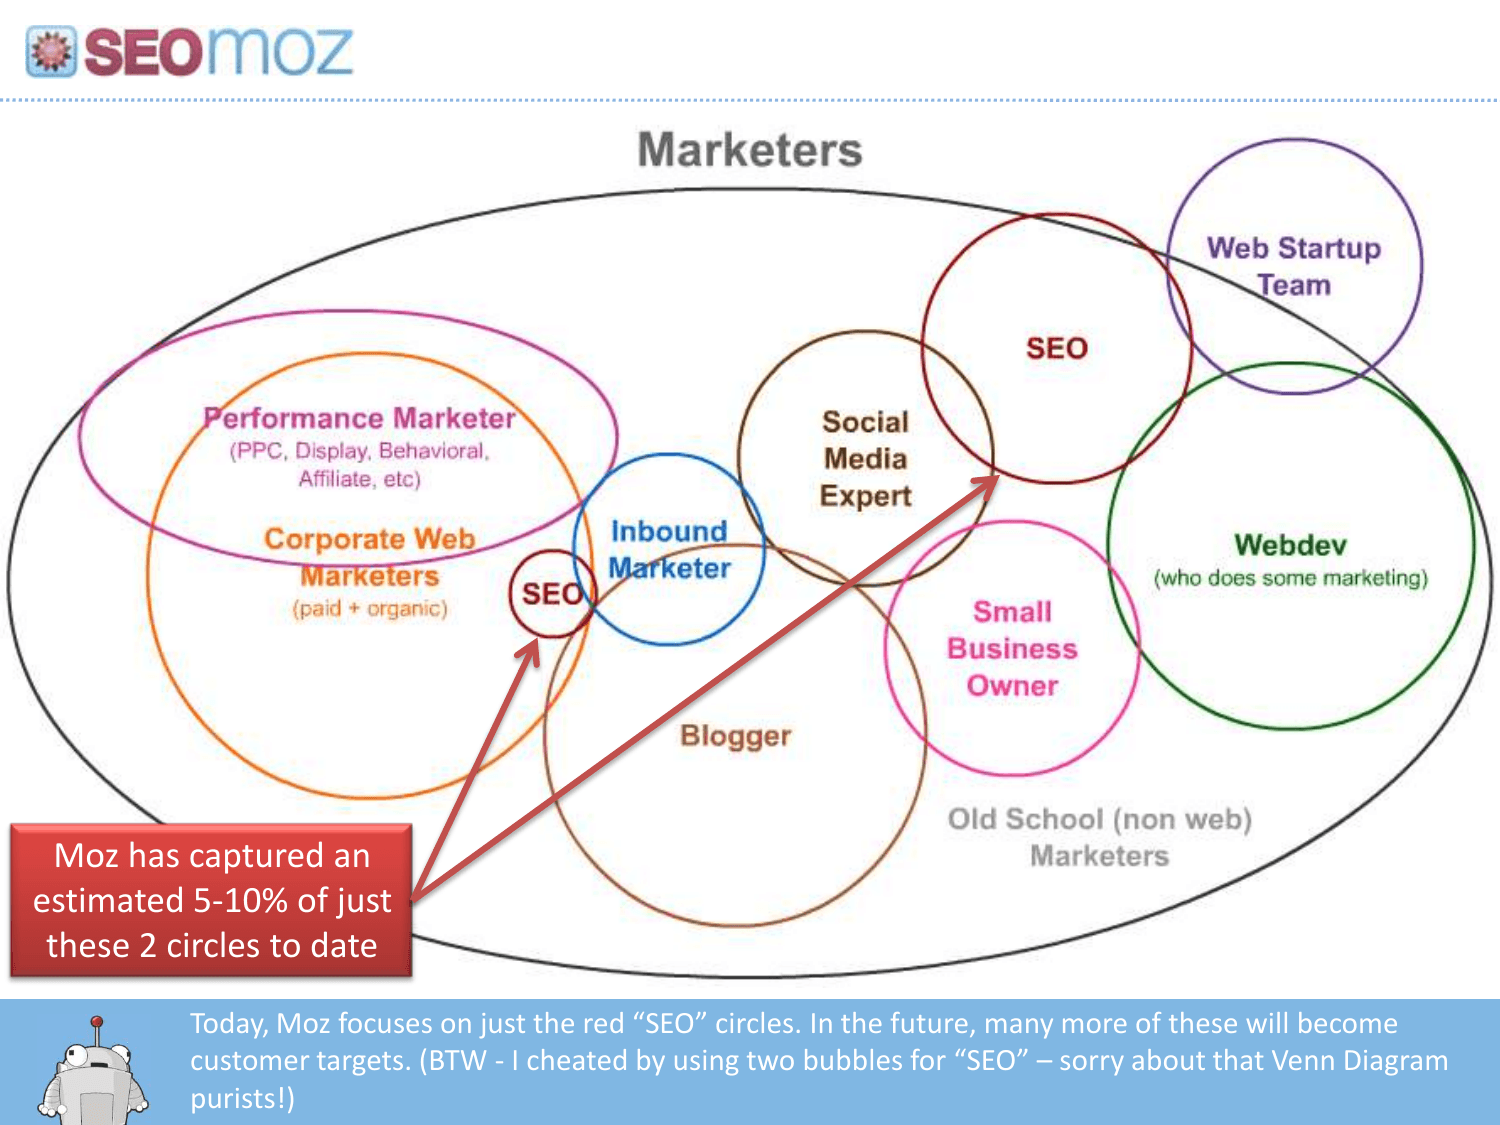
Shows SEO as a wedge into a much larger market. Self-deprecating Venn-diagram humor (two SEO bubbles) builds founder likability.
2×2 grid: experience (none → expert) vs organic focus (none → exclusive). Moz targets moderate-to-expert practitioners with heavy organic focus.
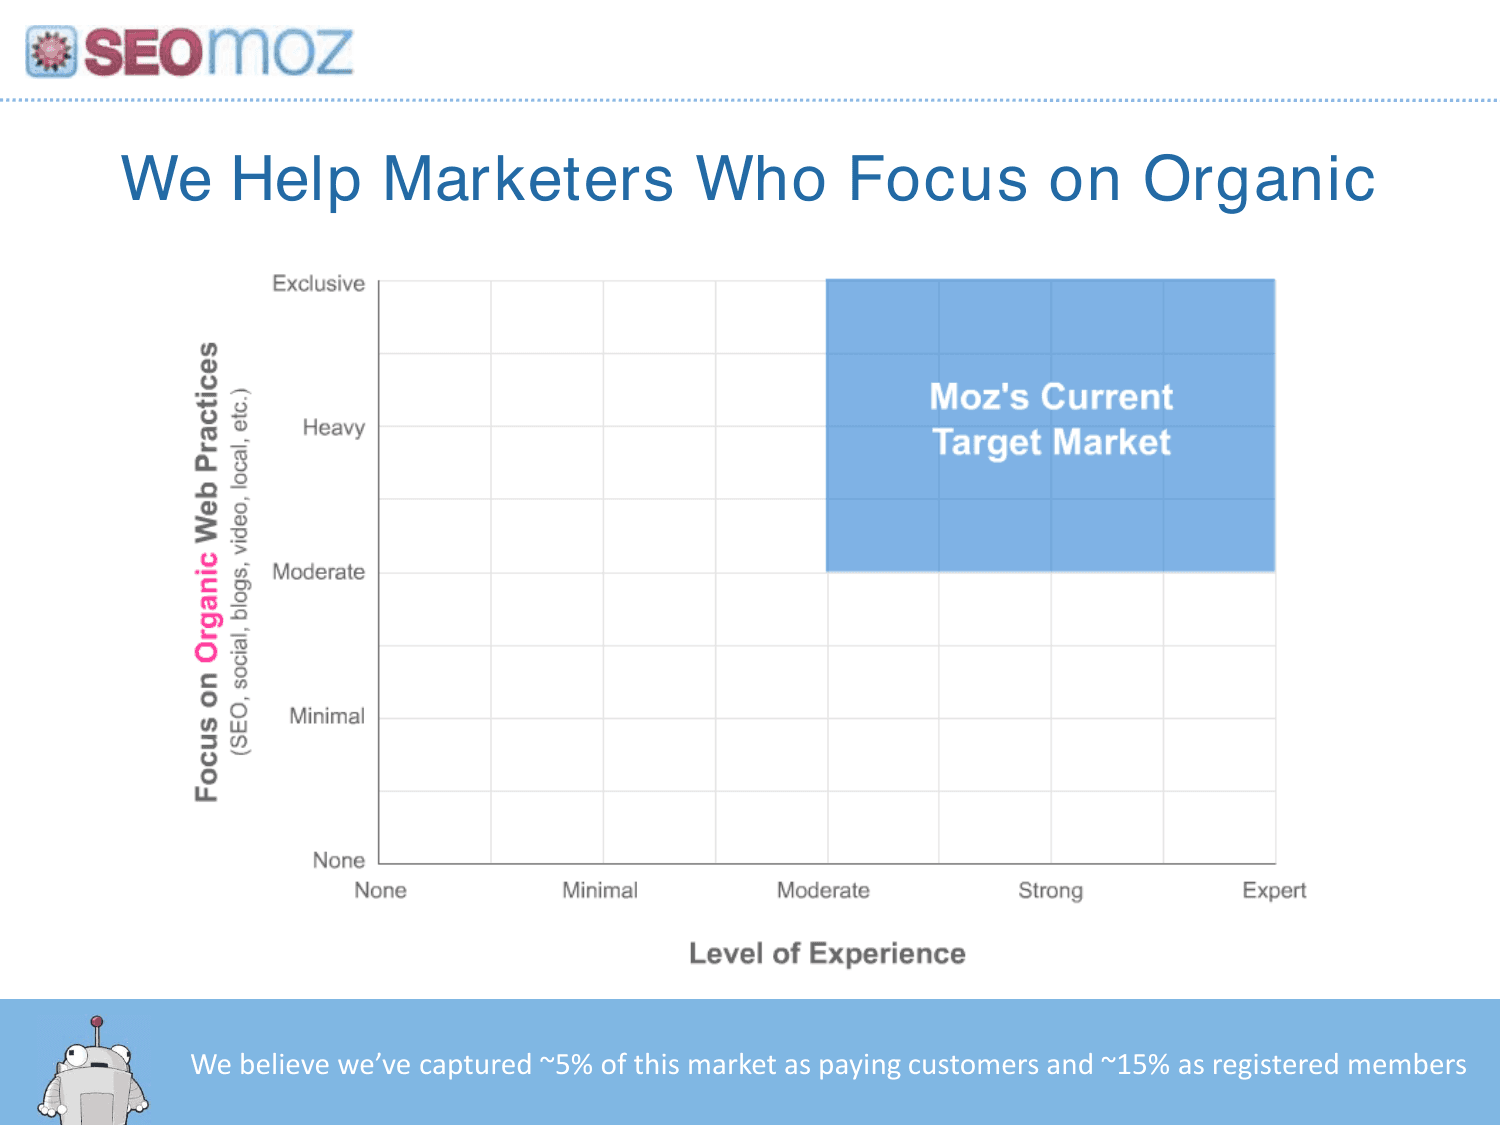
Precise ICP on axes beats 'marketers who need SEO.' The footer claims ~5% paying penetration and ~15% registered, rare early SaaS specificity.
Three segments for 2011–13: in-house (~55%), consultant/agency (~35%), independent (~10%), with job titles listed under each.
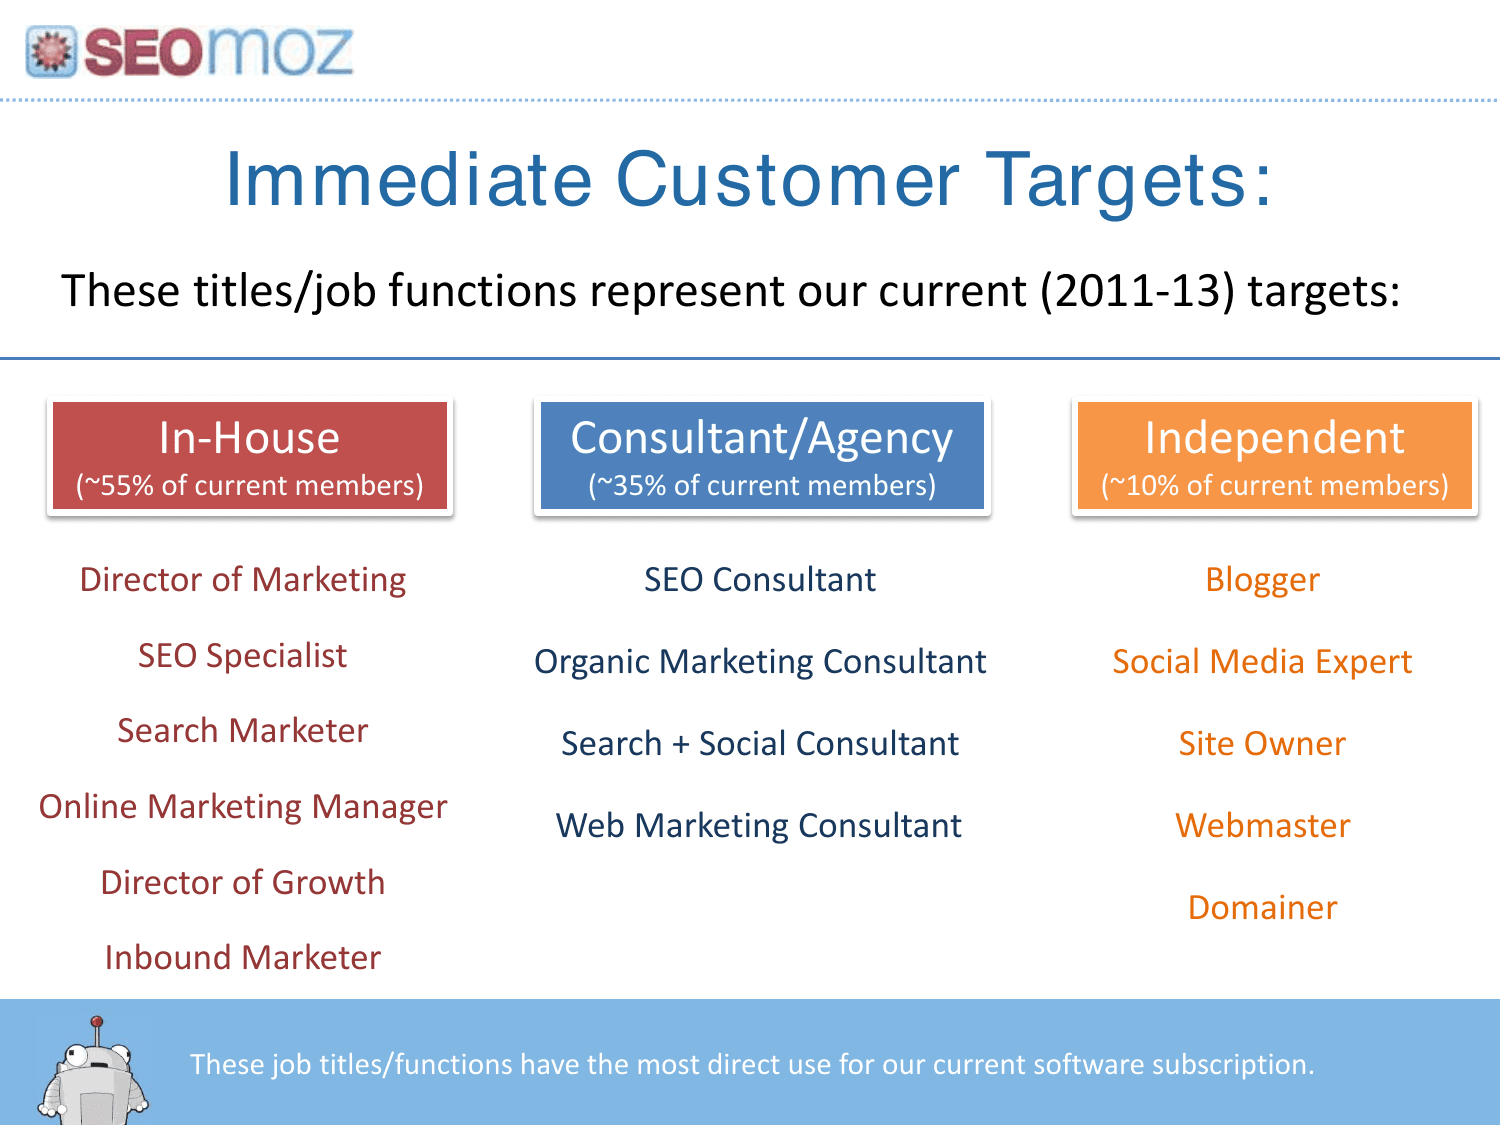
Real membership mix percentages prove they know who pays. Title lists help investors pattern-match against their portfolio companies.
Section divider before traction metrics.

Sets up two slides of dense KPIs. Investors know the numbers are coming, anticipation beats burying metrics without warning.
~$12–13M 2011 revenue, ~$10.8M run rate, ~13,500 PRO subscribers, ~100 free trials/day, ~$900 LTV, ~9-month life, ~$100 paid CAC, ~$93 ARPU.
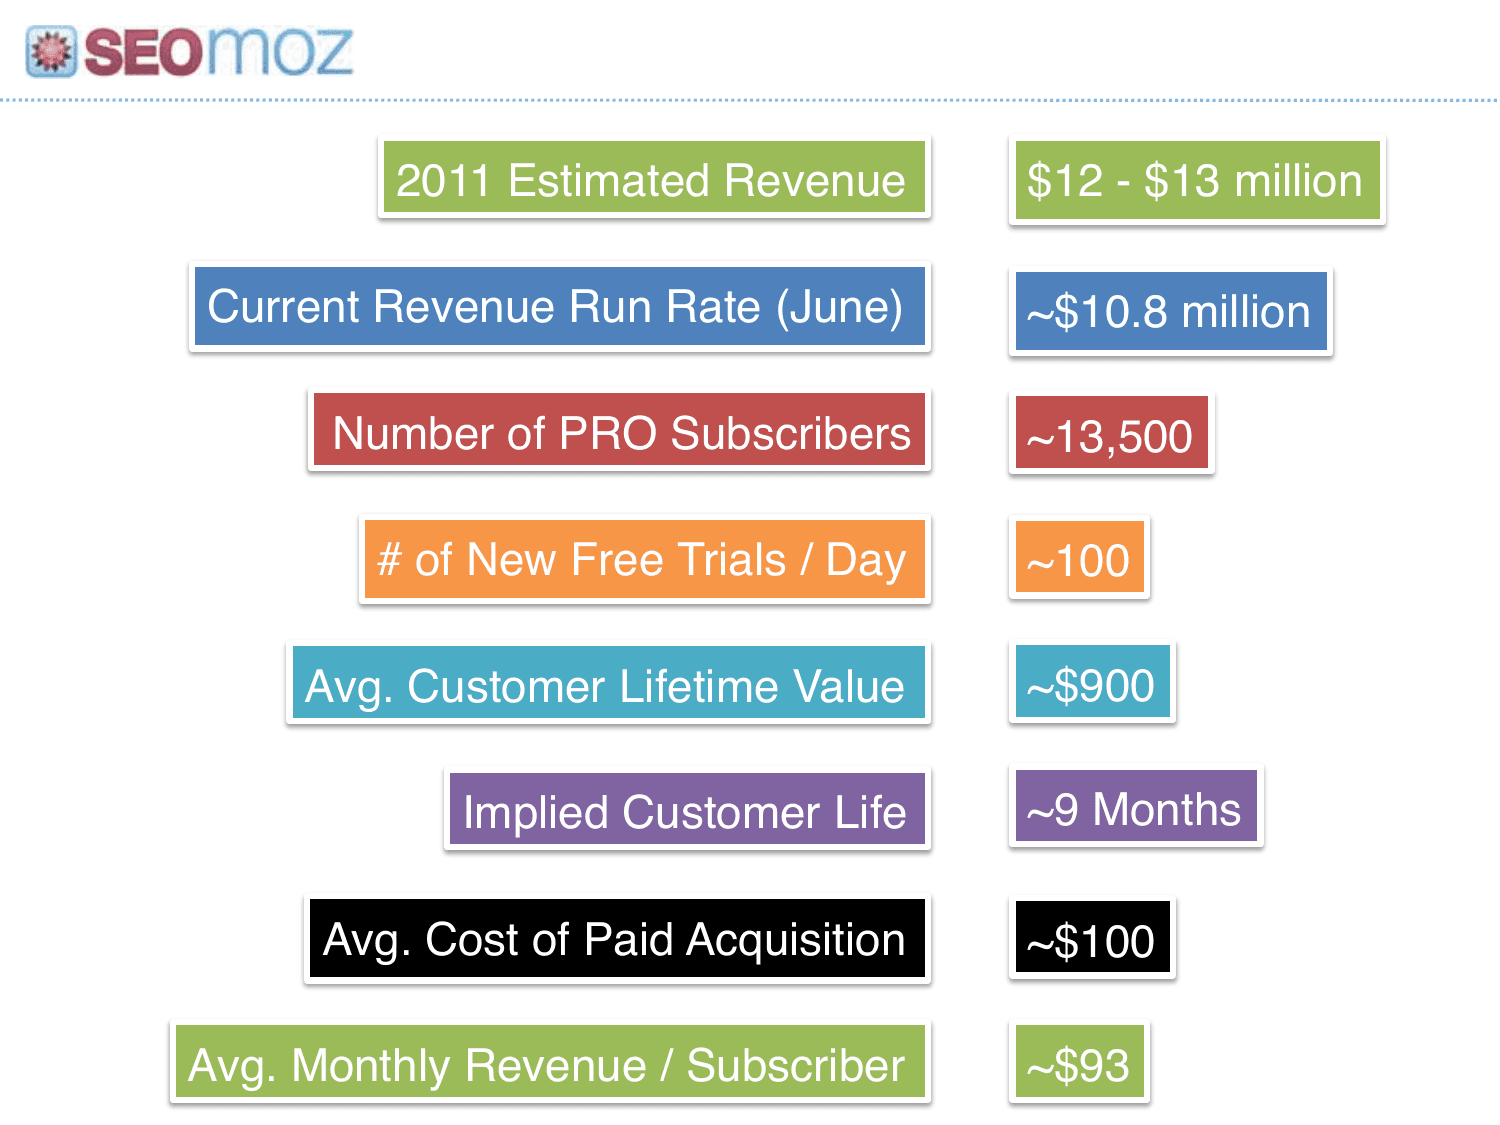
Radical transparency, including ~9-month customer life before investors ask. Color-coded rows make two dozen numbers scannable on one slide.
~57% trial-to-paid conversion, ~25% early churn, 1.25M monthly visits, ~300K email subs, ~82% gross margins, ~$1M net profit, staffing and infra costs listed.
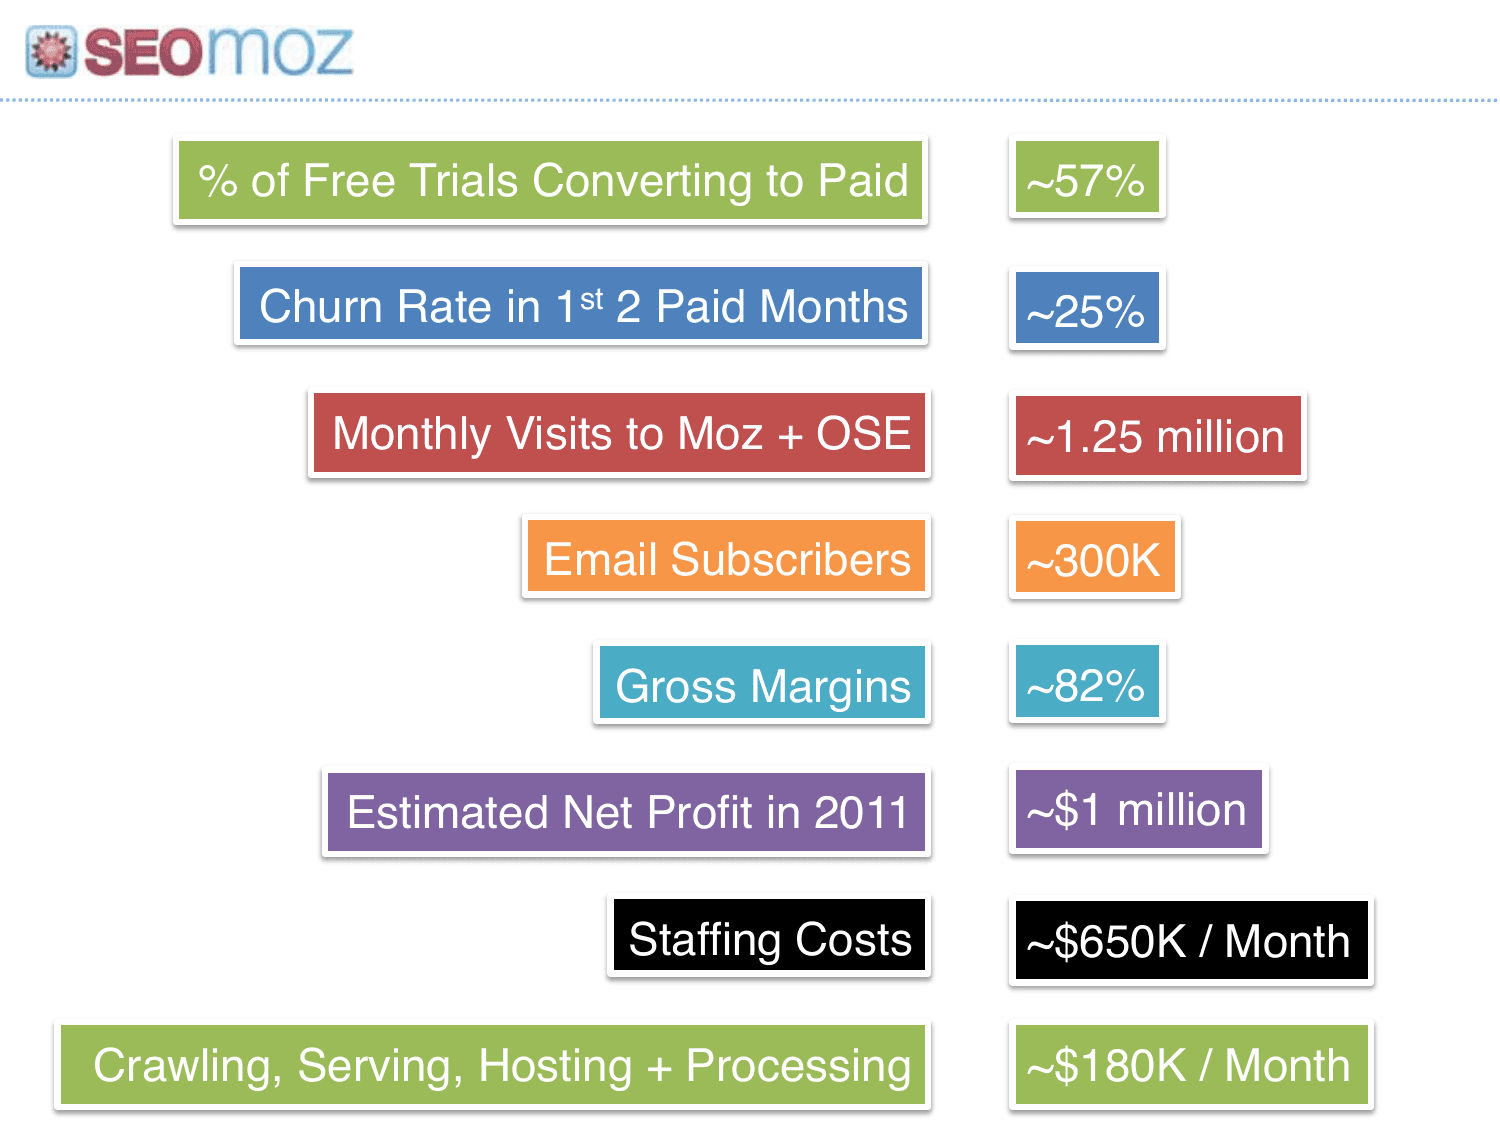
Second metrics slide keeps going, profitable at ~$1M net with 82% margins is the punchline. Most founders hide churn; Moz puts 25% on slide 21.
Section divider before the fundraising terms.

Separates traction from the ask. By slide 22 investors are bought in on the business; now they get the deal structure.
Raising $20–25M: $6–7M founder equity, $13–19M to balance sheet. New board: 2 investors, 2 insiders, 1 independent.
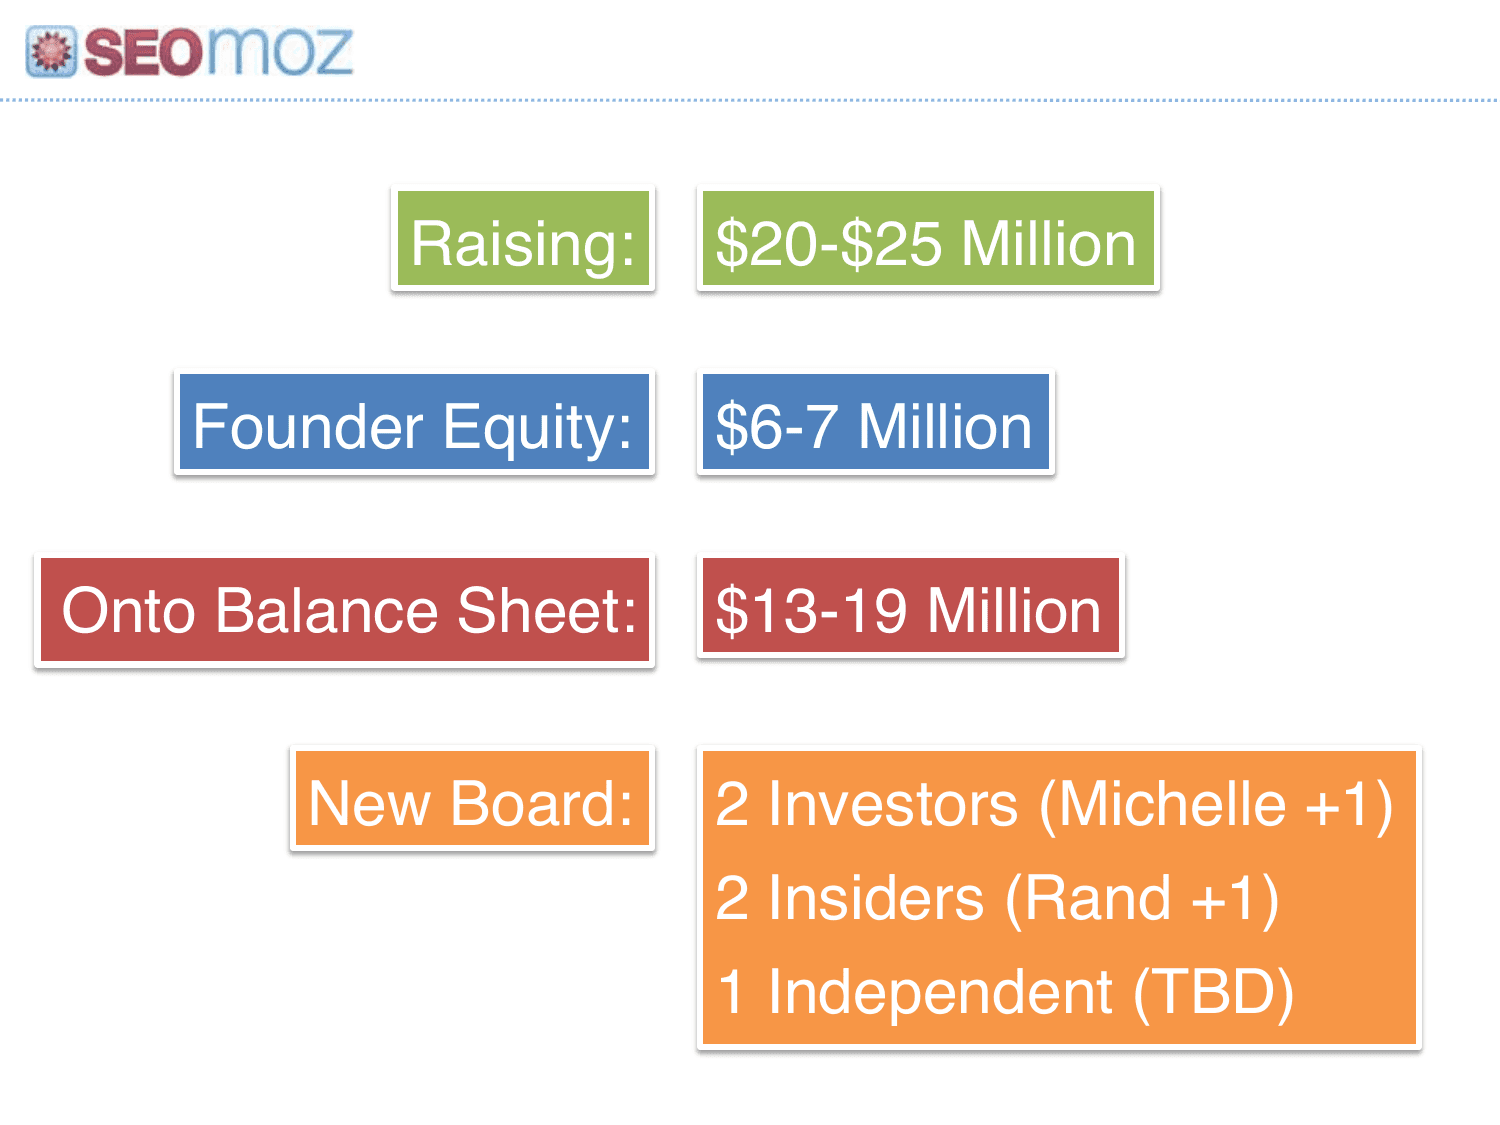
Clean term summary without legalese. Showing secondary (founder equity) alongside primary signals a mature, founder-friendly round.
Section divider, one of the deck's most unusual moves.

Most decks skip risks entirely. A dedicated section header tells investors Moz will be honest about what could go wrong.
Google integrates more SEO and social analytics short-term, illustrated with a Calvin-and-Hobbes-style giant stomping a city.

Names the elephant with humor instead of denial. Memorable visuals on risk slides show confidence, not weakness.
Facebook 'CLOSED' sign over the logo, walled gardens limit measurable organic reach.
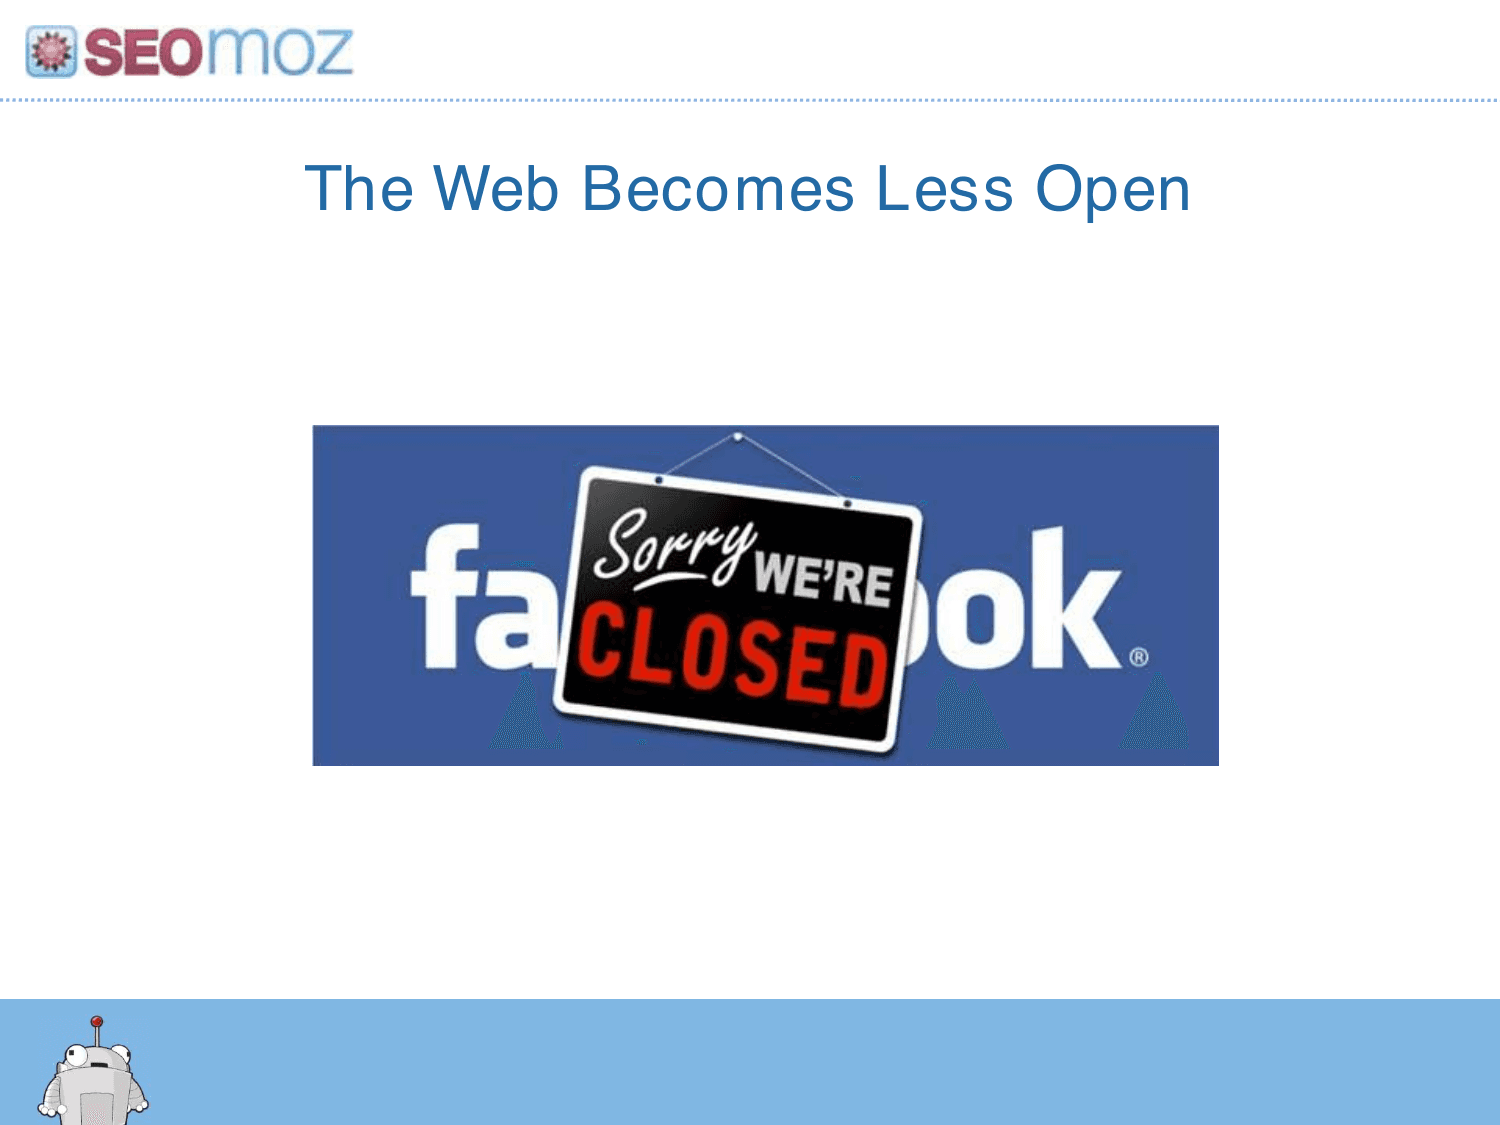
Second platform risk, different angle. Shows they think about structural shifts beyond Google algorithm updates.
Google Trends chart: Digg peaks then collapses while Reddit rises, we fail to adapt fast enough to organic marketing shifts.
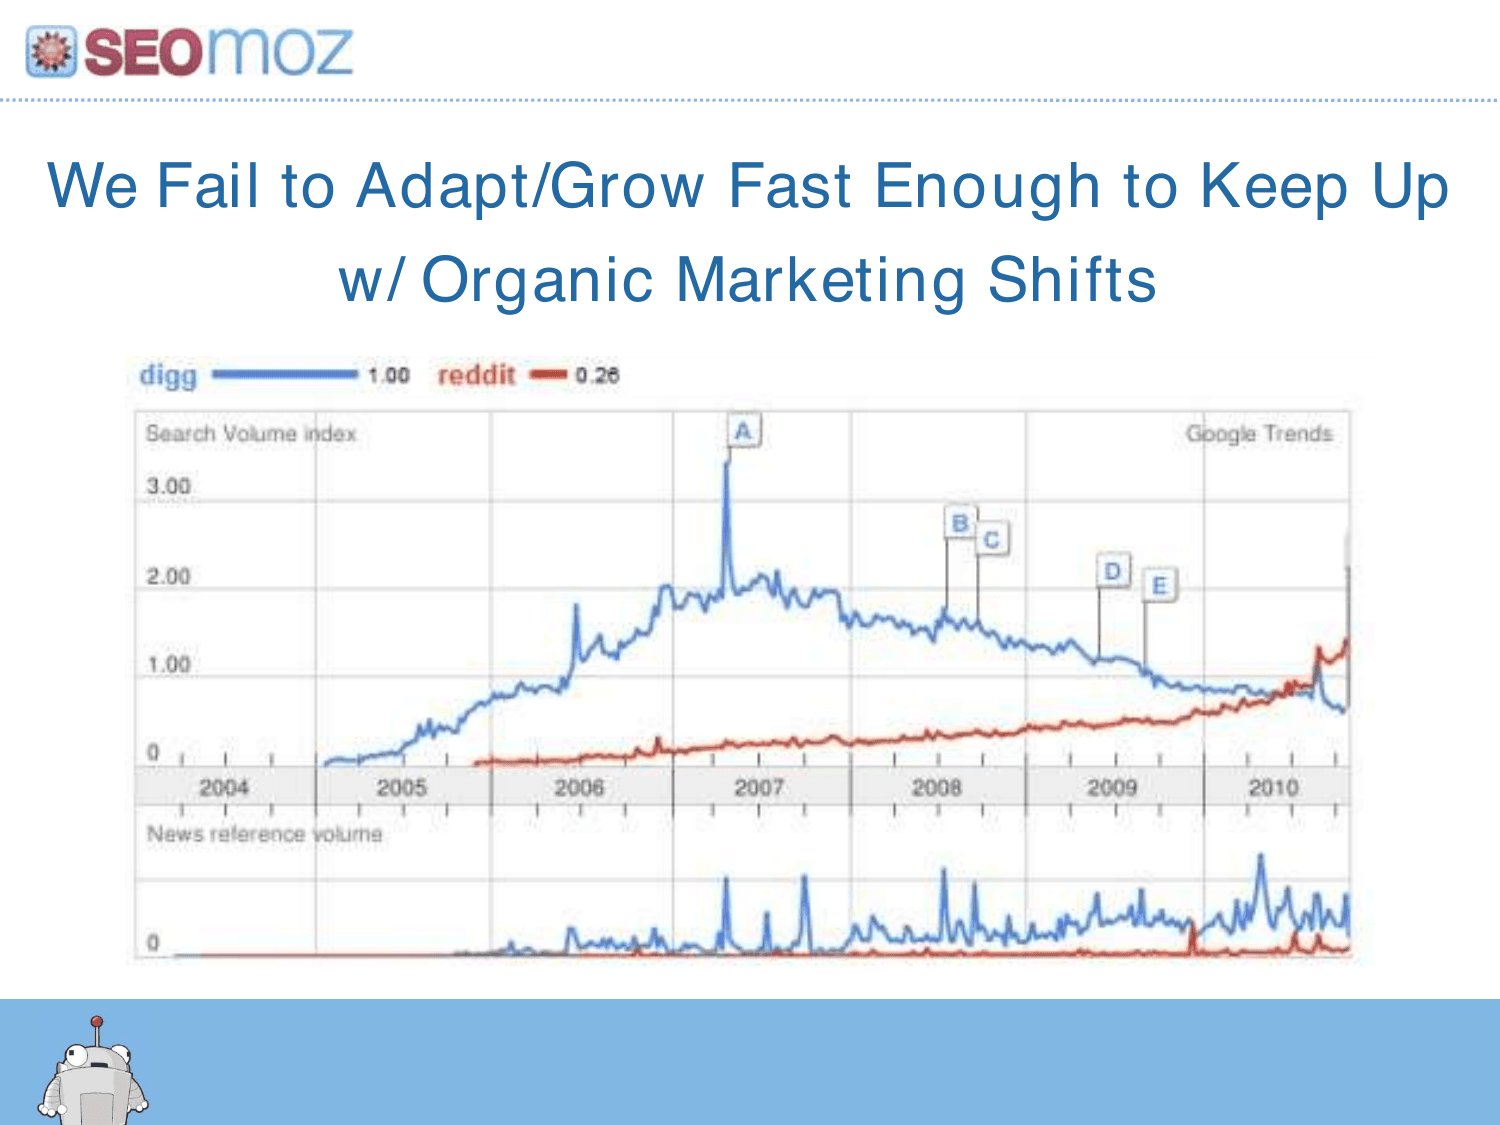
Uses a cautionary tale instead of abstract 'market changes.' Self-directed risk (our failure to adapt) is braver than blaming externals.
Our reputation suffers due to missteps in culture, data quality, or reliability.

Acknowledges brand trust as the asset. For a community-driven company, reputation risk is existential, saying it aloud builds credibility.
Section divider: Use of Funds / Growth Opportunities 2011–2012.
After risks, pivots to how capital fixes them. The 2011–2012 timeframe makes the plan feel immediate, not hypothetical.
2011: SEO + social. 2012: local, brand monitoring, Q&A. 2013+: forums, video, next big thing. Vision: default productivity suite for organic marketers. Office-style grid.
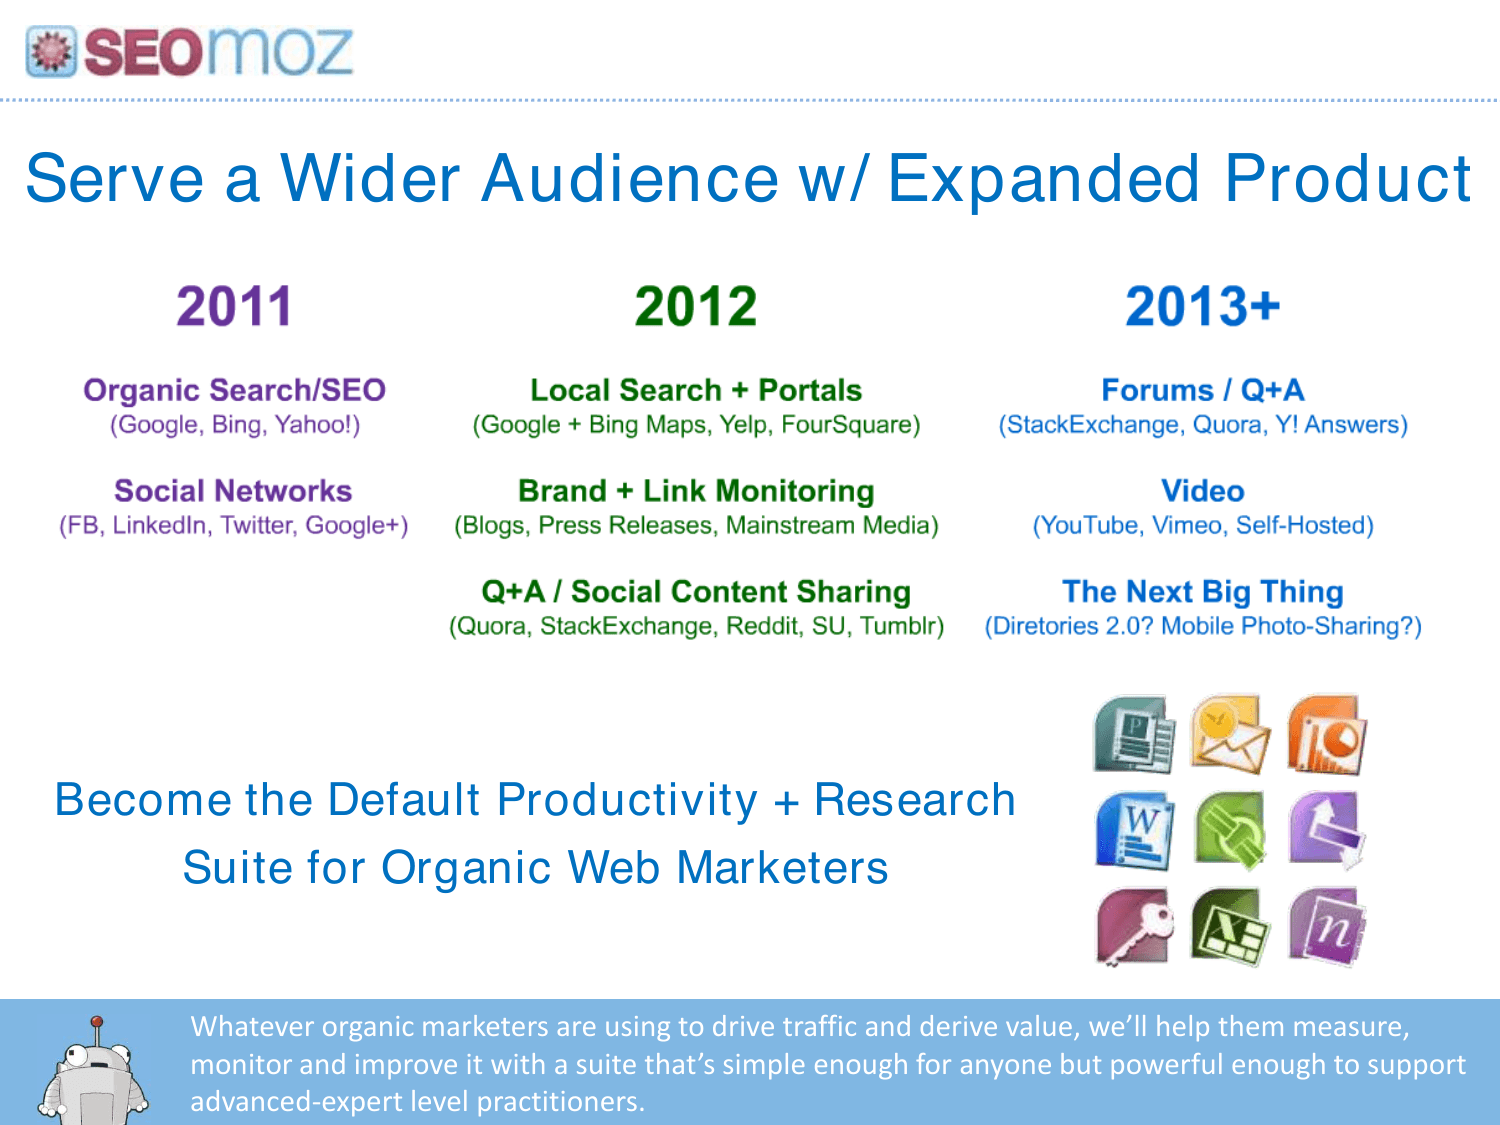
Three-year roadmap shows SEO is the wedge, not the ceiling. The Microsoft Office metaphor gives investors a familiar expansion mental model.
40 → 100 Mozzers in two years across six functions: product, engineering, marketing, operations, customer success, retention.
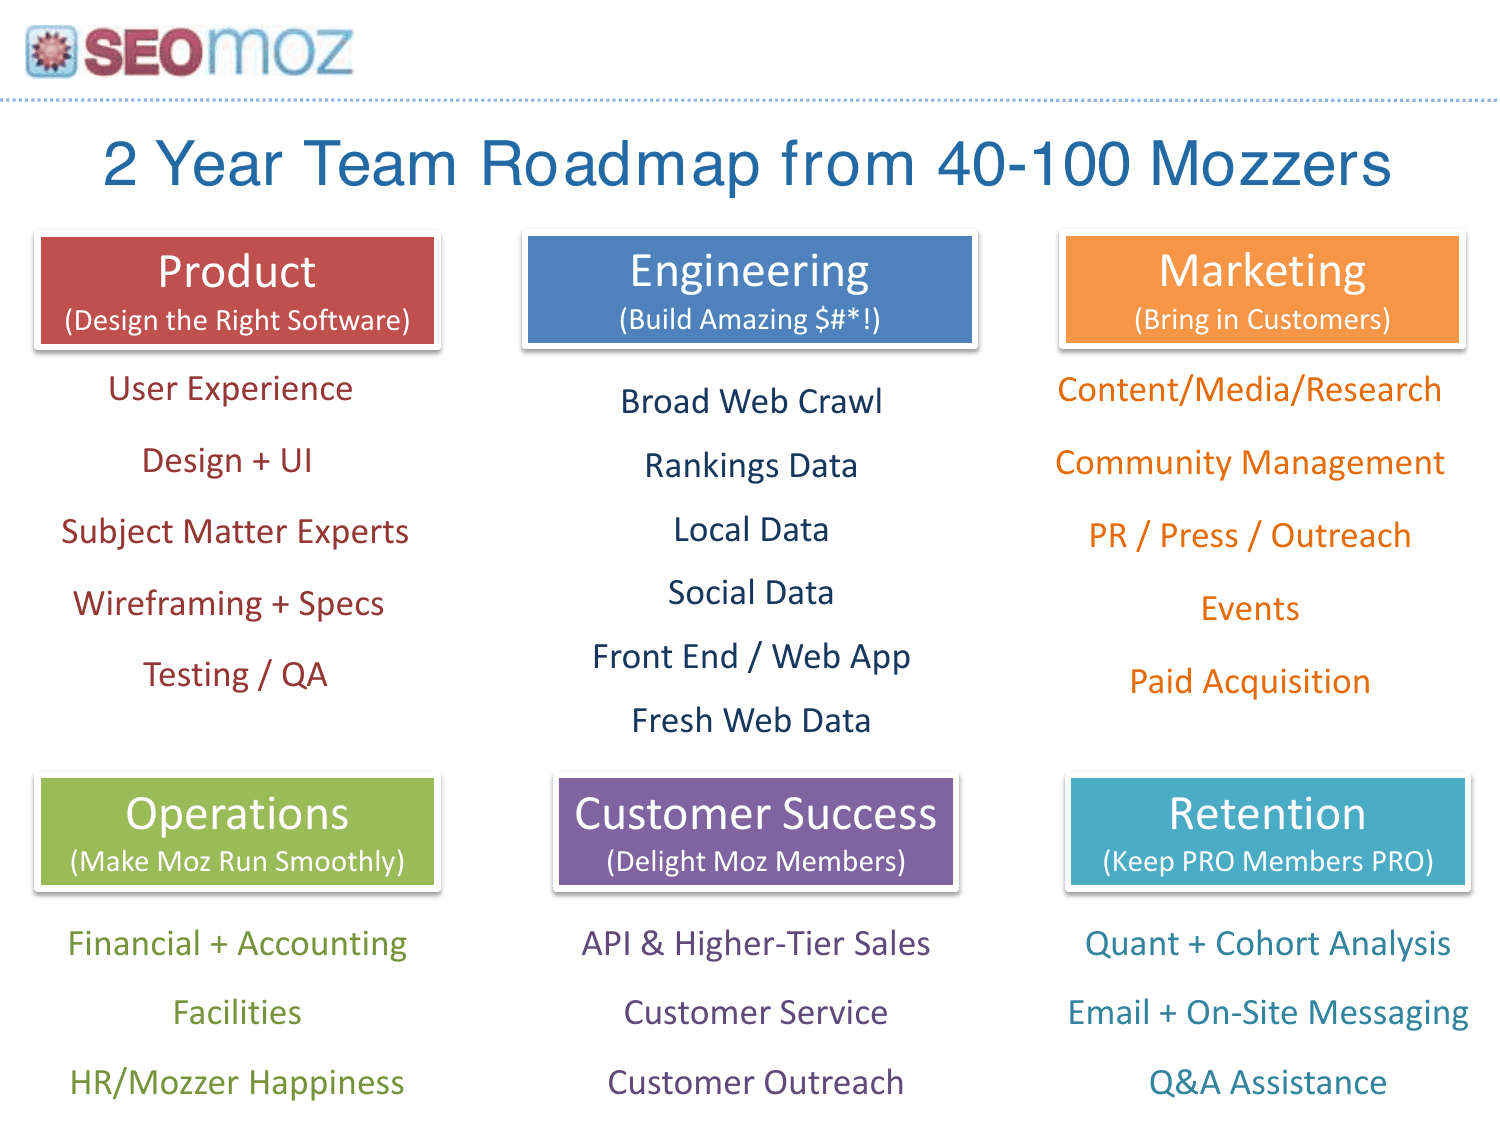
Headcount plan by department proves they know where dollars go. Naming 'Retention' as its own org shows SaaS maturity.
Sales/marketing (organic, paid, branding), technology (crawl, Fresh Web, social graph), product ($25/mo tier, Moz Alerts, human raters).
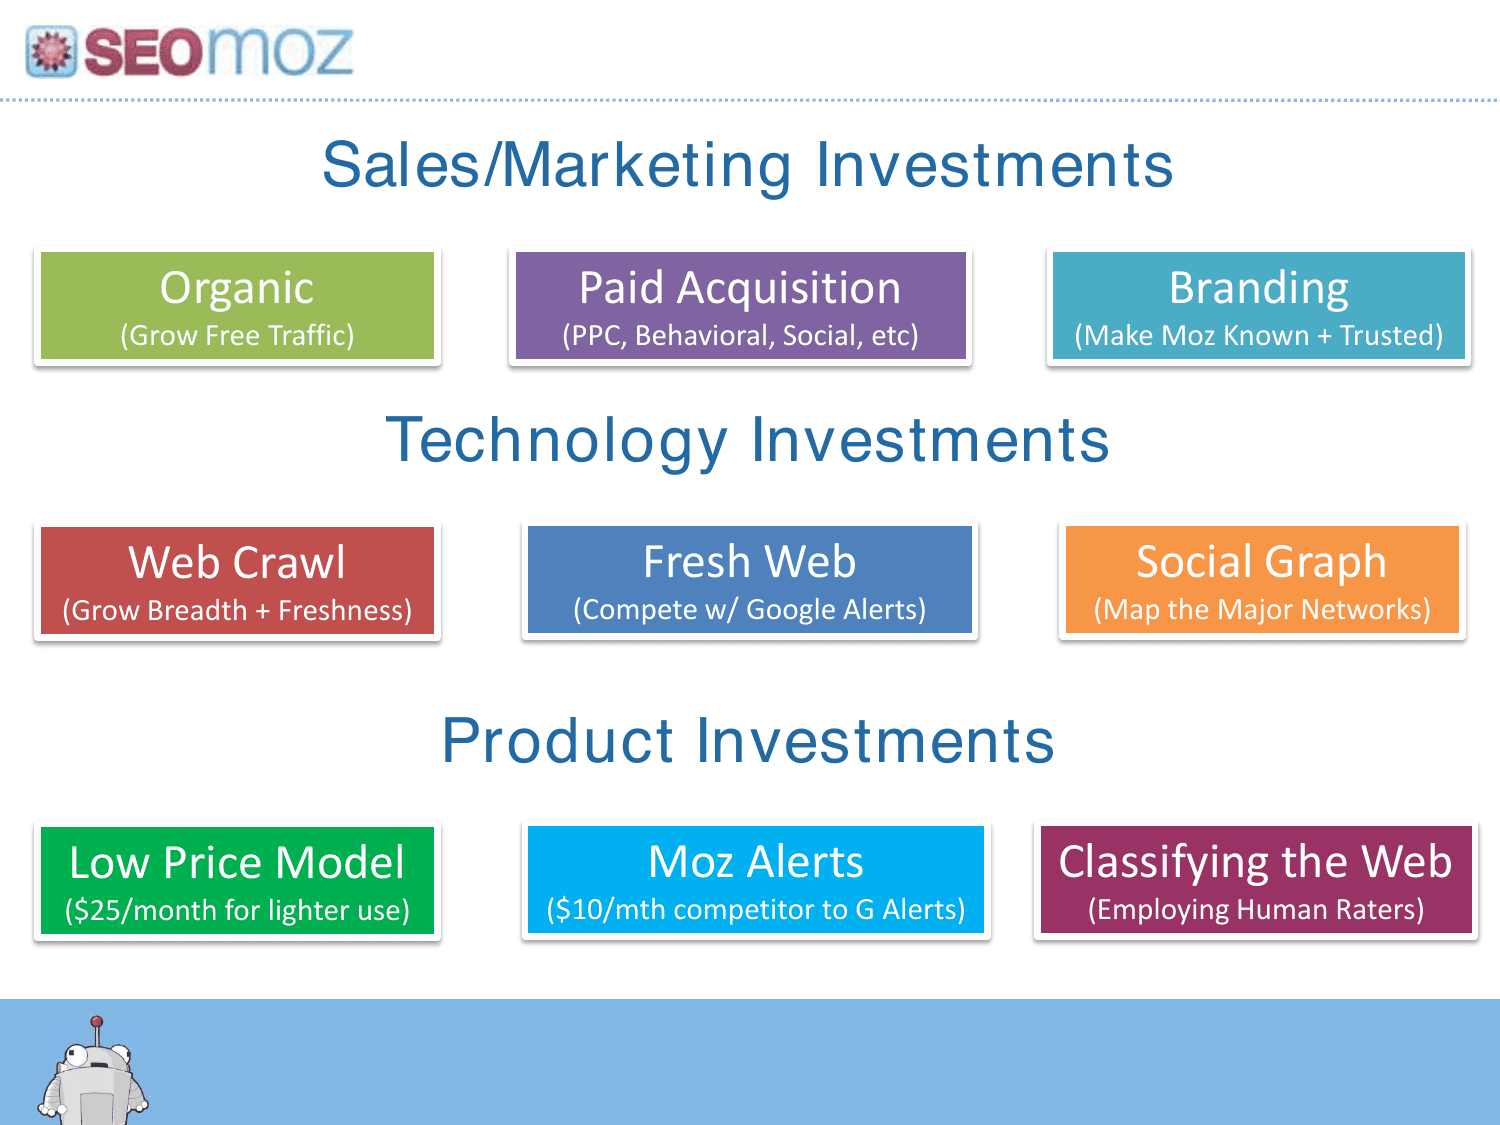
Nine concrete bets instead of 'sales and R&D.' Specific price points ($25/mo, $10/mo alerts) show product thinking, not just burn.
Logo collage of targets. GinzaMetrics, Crowdbooster, Followerwonk, GetListed, Distilled, SEER, and others.
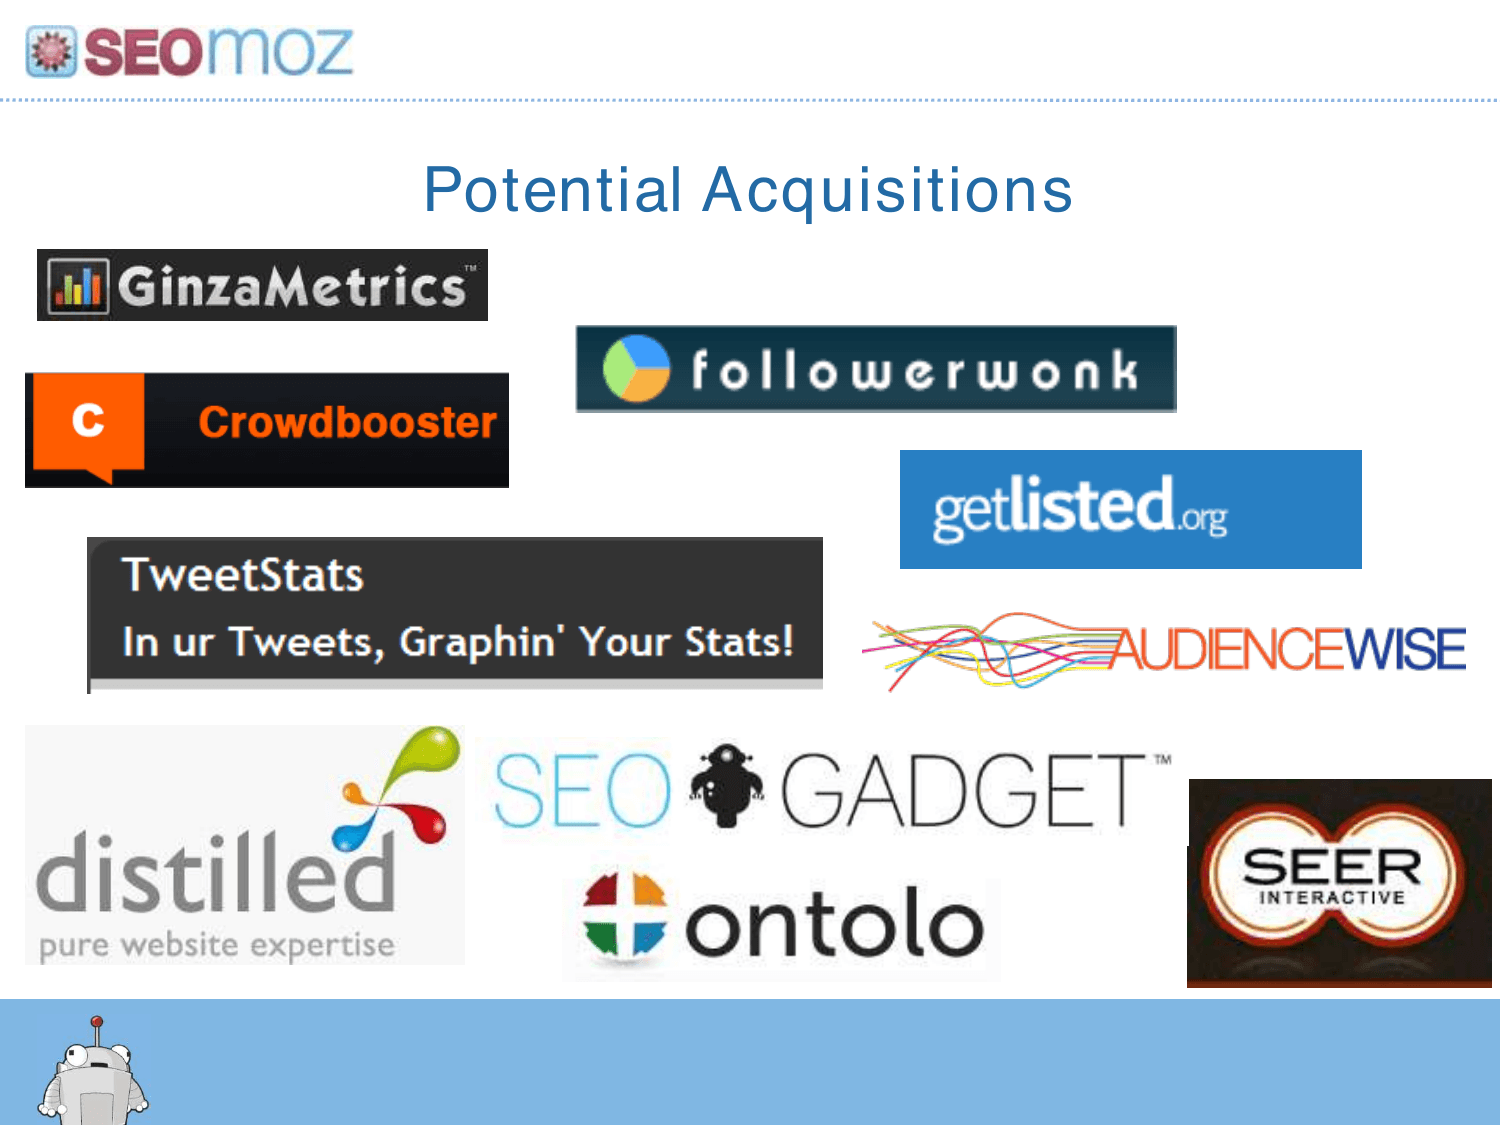
Names real companies investors can diligence. Several (Followerwonk, GetListed) were later acquired, shows strategic foresight.
Section divider: Why Moz is Uniquely Positioned to Win the Organic Market.

Classic 'why us' setup after use-of-funds. Closing sections work best when traction, risks, and plan are already on the table.
#1 300K+ marketer community. #2 Technology lead hard to catch. #3 2X+ growth four years running. #4 Unique culture and attitude.
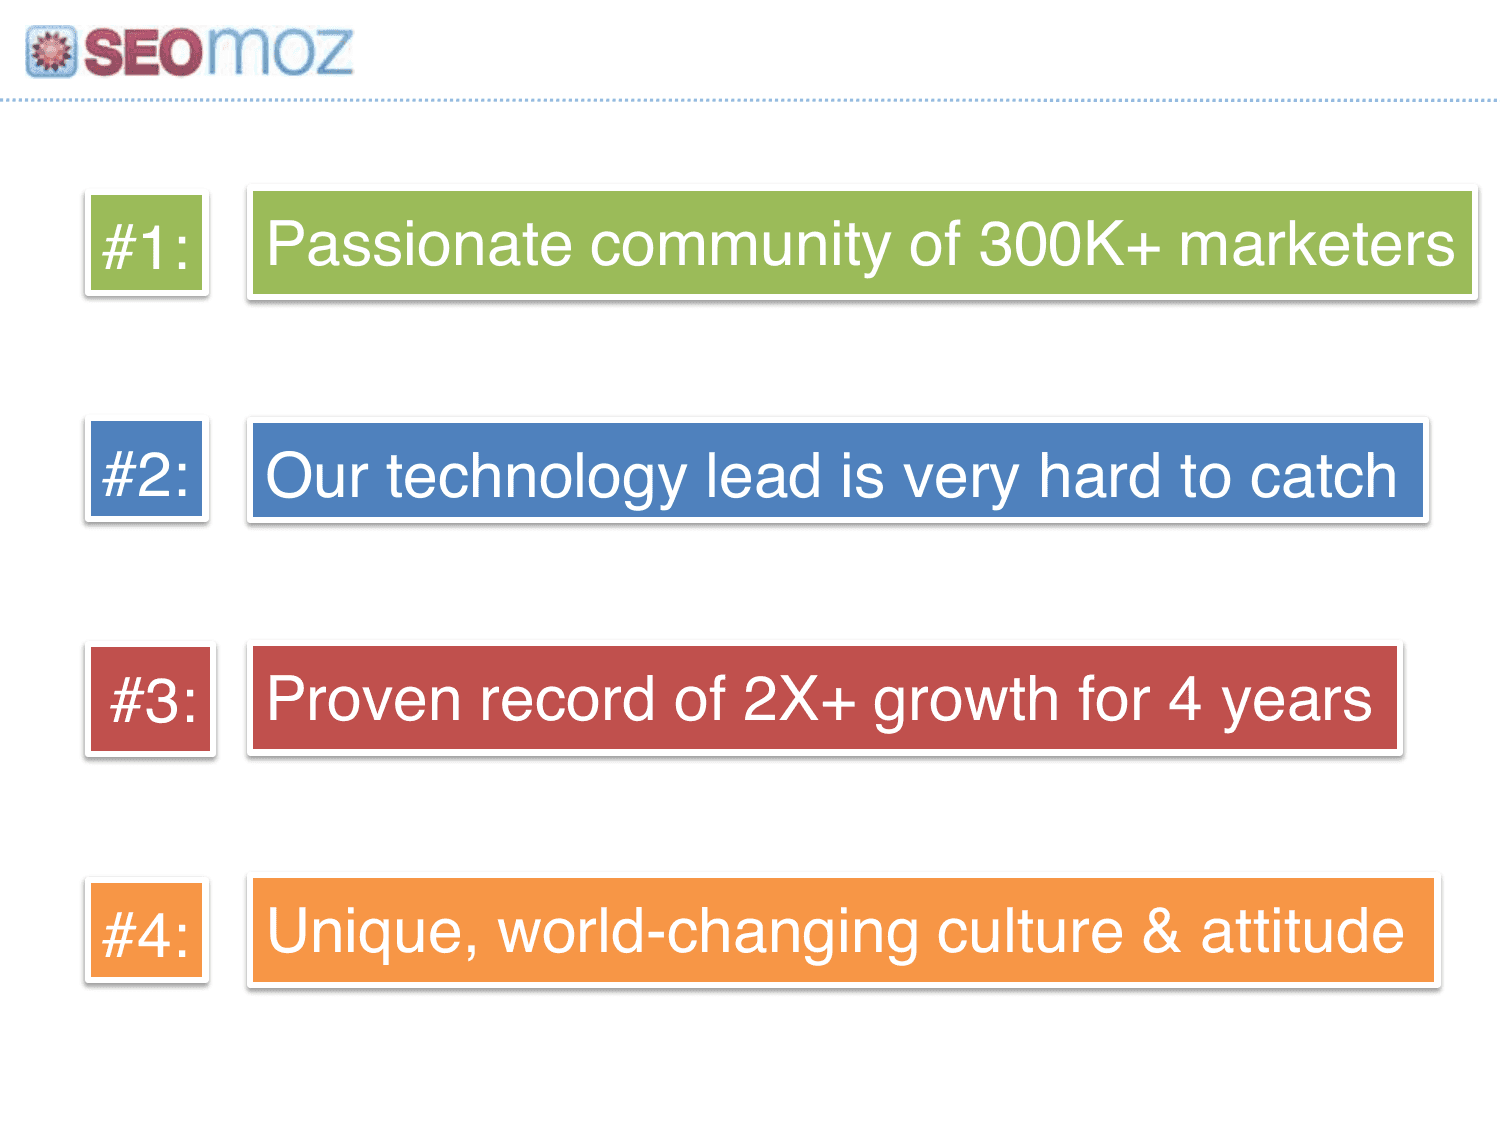
Four numbered bullets, not ten. Community + culture are defensibility claims most SaaS decks skip, on-brand for Moz.
We have a rare opportunity to become Seattle's next $1 billion+ company, and we'd love to have you join us for the ride.

Echoes the cover's $1B ambition with an invitation, not a hard close. Ending on partnership language fits a community company's tone.
Join 100,000+ professionals creating presentations worth presenting.
Moz
Rand Fishkin's July 2011 SEOmoz deck is one of the most studied B2B SaaS pitches ever, a 36-slide memoir that raised ~$18M by telling a 30-year origin story before asking for growth capital. It pairs inbound-marketing proof with unusually honest unit economics and a full risk section.
Original 2011 deck · 36 slides. Click a thumbnail or scroll down for the full breakdown.
The Next Stage of Moz, from Mom + Son consultancy to world SEO software leader and Seattle's next $1B company. Rand Fishkin, July 2011.
The subtitle reads like a memoir chapter, not a tagline. Investors know immediately this is a story-driven deck from a founder who has already built something real.
Color timeline from 1981 (Gillian founds the company) through July 2011, blog launch, $39/mo PRO, $1.1M Series A, Linkscape, tiered pricing, Moz.com acquisition.
Thirty years on one slide replaces a team-credentials page. The footnote about paying off $500K personal debt adds founder authenticity investors remember.
Dual-axis chart: software revenue grows from $400K (2007) to $12.5M (2011) while consulting fades; monthly visits hit 1.25M. Callouts note the 2007 raise, 2009 consulting exit, 10K+ subscribers, and 83%+ margins.
Annotated financing beats a bullet list, each capital event gets context. Showing the consulting-to-SaaS pivot in one chart proves the business model shift worked.
Roger MozBot asks the rhetorical question in a speech bubble, a section divider before the growth strategy.
A single question slide resets attention after heavy data. Founders with long decks need these breathing-room transitions.
Eighteen traffic sources, blogs, SEO, social, PR, webinars, infographics, all arrow into 'INBOUND MARKETING.' Footer: zero paid customer acquisition until 2010.
Moz literally demos its GTM on a slide. Claiming years without PPC while pitching an SEO company is the strongest possible social proof.
That's what we want to help other companies measure and improve through our cloud-based software.
Bridges inbound philosophy to the product ask in one sentence. Keeps the narrative flowing instead of jumping straight to feature screenshots.
Section header: Macroeconomic Trends that Benefit Moz.
Signals a shift from company story to market tailwinds. Section dividers with consistent Roger branding make 36 slides feel structured.
FTI Consulting stacked-bar chart: total ad spend by media 2007–2014, with internet share growing while newspapers shrink.
Third-party data anchors the macro thesis. Citing FTI Consulting gives investors a source they can verify, not founder opinion.
Pie chart of web traffic sources: organic drives 90%+ of traffic on ~$5B spend; paid drives under 10% on $31B+.
The organic-vs-paid spend gap is Moz's entire market thesis in one visual. Red/green callouts make the inefficiency impossible to miss.
Three personas. Executives ('Do more with less'), Marketing Managers ('Free traffic only scales with people'), Web Marketers ('Right tools + data = work of 10').
Persona slides with humor (Sealevelis HIPPOdronica) keep B2B copy human. Each stakeholder's pain maps to a software scalability problem.
Section divider introducing the problem framing.
After macro trends, this pivot says 'here's what we actually sell against.' Clear problem sections help investors track the narrative arc.
Four-step loop: invest in content/search/social → measure ROI → reinvest in winners → earn outsized rewards vs paid channels.
Teaches the category before selling the product. Investors learn the playbook Moz automates, classic category-creation pitching.
Marketers log into 10+ tools weekly. Google Analytics, Facebook, Twitter, Webmaster Tools, Bit.ly, and more, tiered by how many use each.
Named tools make the fragmentation pain concrete. The closing line, put it all in one place, is the product thesis without a screenshot.
Six manual jobs: researching opportunities, finding high-ROI channels, prioritizing tasks, finding errors, optimizing channels, training new marketers.
Grid layout turns abstract 'SEO is hard' into six billable workflows. Positions Moz as horizontal marketing ops software, not a single-feature tool.
Section divider before market segmentation slides.
Another clean break before TAM-style content. Long decks need explicit chapter markers so investors don't get lost.
Overlapping circles for SEO, inbound, bloggers, agencies, SMB owners, and more. Moz has captured 5–10% of just the two SEO circles.
Shows SEO as a wedge into a much larger market. Self-deprecating Venn-diagram humor (two SEO bubbles) builds founder likability.
2×2 grid: experience (none → expert) vs organic focus (none → exclusive). Moz targets moderate-to-expert practitioners with heavy organic focus.
Precise ICP on axes beats 'marketers who need SEO.' The footer claims ~5% paying penetration and ~15% registered, rare early SaaS specificity.
Three segments for 2011–13: in-house (~55%), consultant/agency (~35%), independent (~10%), with job titles listed under each.
Real membership mix percentages prove they know who pays. Title lists help investors pattern-match against their portfolio companies.
Section divider before traction metrics.
Sets up two slides of dense KPIs. Investors know the numbers are coming, anticipation beats burying metrics without warning.
~$12–13M 2011 revenue, ~$10.8M run rate, ~13,500 PRO subscribers, ~100 free trials/day, ~$900 LTV, ~9-month life, ~$100 paid CAC, ~$93 ARPU.
Radical transparency, including ~9-month customer life before investors ask. Color-coded rows make two dozen numbers scannable on one slide.
~57% trial-to-paid conversion, ~25% early churn, 1.25M monthly visits, ~300K email subs, ~82% gross margins, ~$1M net profit, staffing and infra costs listed.
Second metrics slide keeps going, profitable at ~$1M net with 82% margins is the punchline. Most founders hide churn; Moz puts 25% on slide 21.
Section divider before the fundraising terms.
Separates traction from the ask. By slide 22 investors are bought in on the business; now they get the deal structure.
Raising $20–25M: $6–7M founder equity, $13–19M to balance sheet. New board: 2 investors, 2 insiders, 1 independent.
Clean term summary without legalese. Showing secondary (founder equity) alongside primary signals a mature, founder-friendly round.
Section divider, one of the deck's most unusual moves.
Most decks skip risks entirely. A dedicated section header tells investors Moz will be honest about what could go wrong.
Google integrates more SEO and social analytics short-term, illustrated with a Calvin-and-Hobbes-style giant stomping a city.
Names the elephant with humor instead of denial. Memorable visuals on risk slides show confidence, not weakness.
Facebook 'CLOSED' sign over the logo, walled gardens limit measurable organic reach.
Second platform risk, different angle. Shows they think about structural shifts beyond Google algorithm updates.
Google Trends chart: Digg peaks then collapses while Reddit rises, we fail to adapt fast enough to organic marketing shifts.
Uses a cautionary tale instead of abstract 'market changes.' Self-directed risk (our failure to adapt) is braver than blaming externals.
Our reputation suffers due to missteps in culture, data quality, or reliability.
Acknowledges brand trust as the asset. For a community-driven company, reputation risk is existential, saying it aloud builds credibility.
Section divider: Use of Funds / Growth Opportunities 2011–2012.
After risks, pivots to how capital fixes them. The 2011–2012 timeframe makes the plan feel immediate, not hypothetical.
2011: SEO + social. 2012: local, brand monitoring, Q&A. 2013+: forums, video, next big thing. Vision: default productivity suite for organic marketers. Office-style grid.
Three-year roadmap shows SEO is the wedge, not the ceiling. The Microsoft Office metaphor gives investors a familiar expansion mental model.
40 → 100 Mozzers in two years across six functions: product, engineering, marketing, operations, customer success, retention.
Headcount plan by department proves they know where dollars go. Naming 'Retention' as its own org shows SaaS maturity.
Sales/marketing (organic, paid, branding), technology (crawl, Fresh Web, social graph), product ($25/mo tier, Moz Alerts, human raters).
Nine concrete bets instead of 'sales and R&D.' Specific price points ($25/mo, $10/mo alerts) show product thinking, not just burn.
Logo collage of targets. GinzaMetrics, Crowdbooster, Followerwonk, GetListed, Distilled, SEER, and others.
Names real companies investors can diligence. Several (Followerwonk, GetListed) were later acquired, shows strategic foresight.
Section divider: Why Moz is Uniquely Positioned to Win the Organic Market.
Classic 'why us' setup after use-of-funds. Closing sections work best when traction, risks, and plan are already on the table.
#1 300K+ marketer community. #2 Technology lead hard to catch. #3 2X+ growth four years running. #4 Unique culture and attitude.
Four numbered bullets, not ten. Community + culture are defensibility claims most SaaS decks skip, on-brand for Moz.
We have a rare opportunity to become Seattle's next $1 billion+ company, and we'd love to have you join us for the ride.
Echoes the cover's $1B ambition with an invitation, not a hard close. Ending on partnership language fits a community company's tone.
Join 100,000+ professionals creating presentations worth presenting.