
Original 2007 deck · 16 slides. Click a thumbnail or scroll down for the full breakdown.
Mint
Mint's 2007 Series A deck raised $4.7M by pitching free personal finance software when Quicken still owned the category. Aaron Patzer opened with a full product mockup, not a problem slide, then walked investors through referral economics, partner acquisition costs, and a prescient Intuit exit path. Intuit acquired Mint for $170M in 2009. This teardown covers all 16 slides, including Q&A backup and financial appendix.
Original 2007 deck · 16 slides. Click a thumbnail or scroll down for the full breakdown.
Mint logo with the tagline "Take Back Your Wallet", dated April 20, 2007.
Consumer-facing tagline on a B2B deck signals Mint knew the brand story had to feel personal, not enterprise. Investors see the consumer promise before any financials.
Full dashboard mockup, calendar bill reminders, account balances, spending pie chart, savings goals, and personalized switch recommendations for credit cards and cell plans.
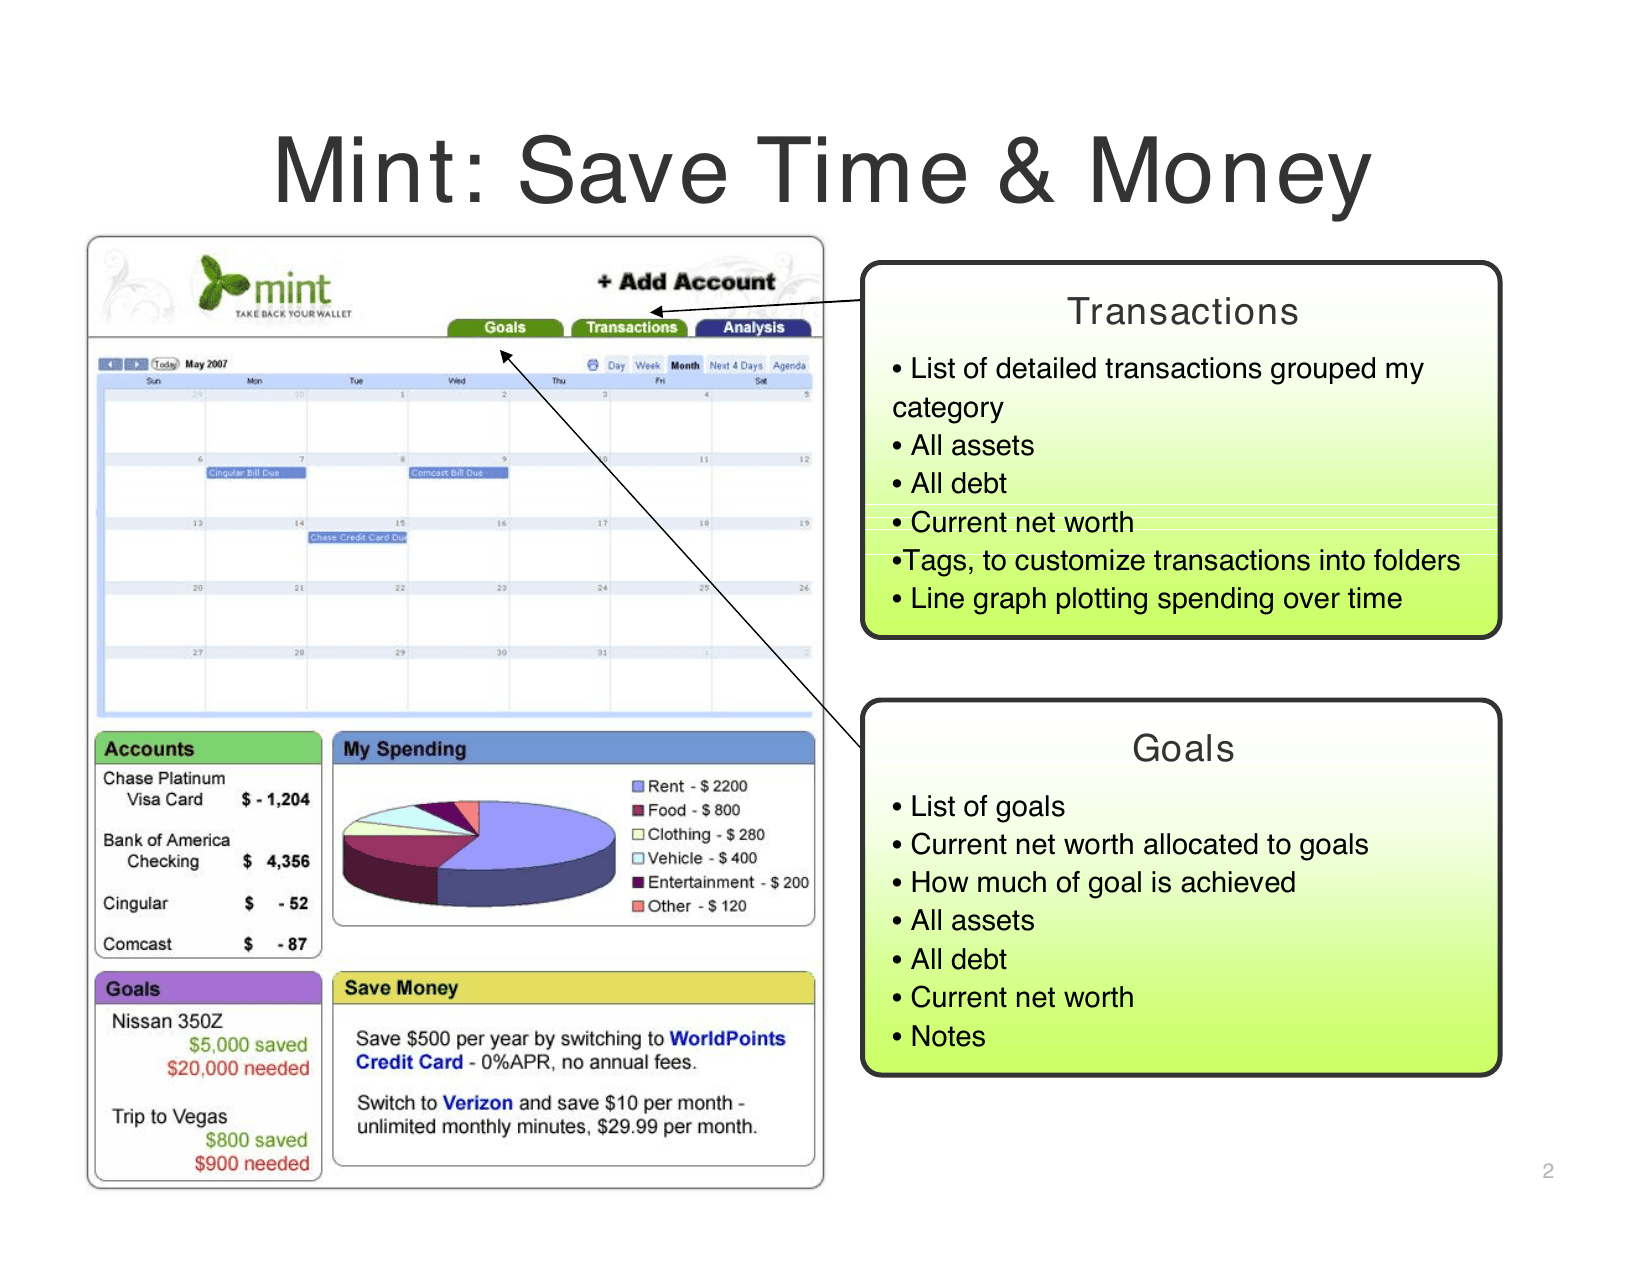
Product before team or market, the deck proves the experience exists. Feature callouts for Transactions and Goals map directly to time saved and money saved, the two outcomes on the title.
Aaron Patzer (CEO), David Michaels (VP Engineering), Dave McClure (Marketing), Jason Putorti (Lead Designer), backed by First Round Capital, Felicis Ventures, Ron Conway, and Scott Cook of Intuit.
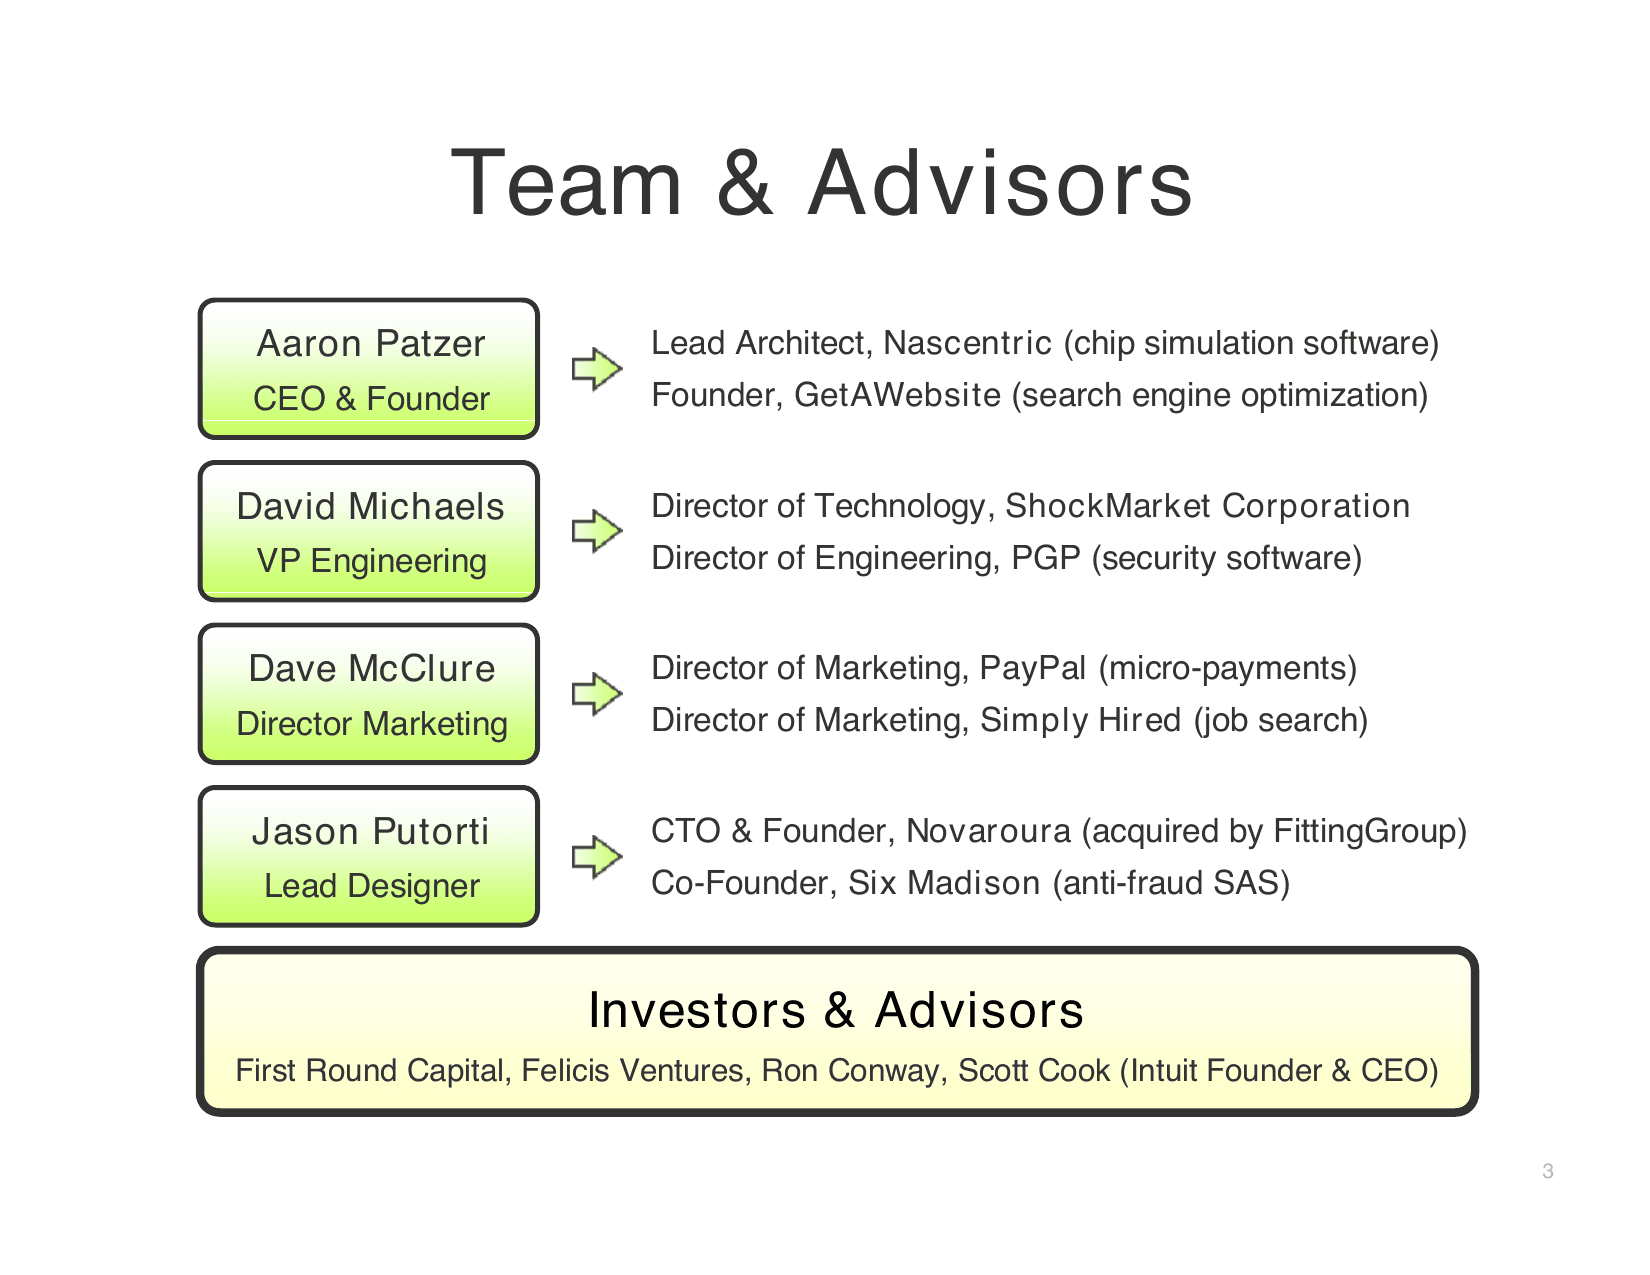
Scott Cook on the cap table is strategic foreshadowing. Intuit's founder validating a Quicken challenger. PayPal and PGP alumni on the team de-risk aggregation security and payments.
31M prospective users (64% of 49M people aged 22–35 use online banking) × $12.50 blended RPU from referrals ($8) and advertising ($4.50) = $388M TAM at 16% CAGR.
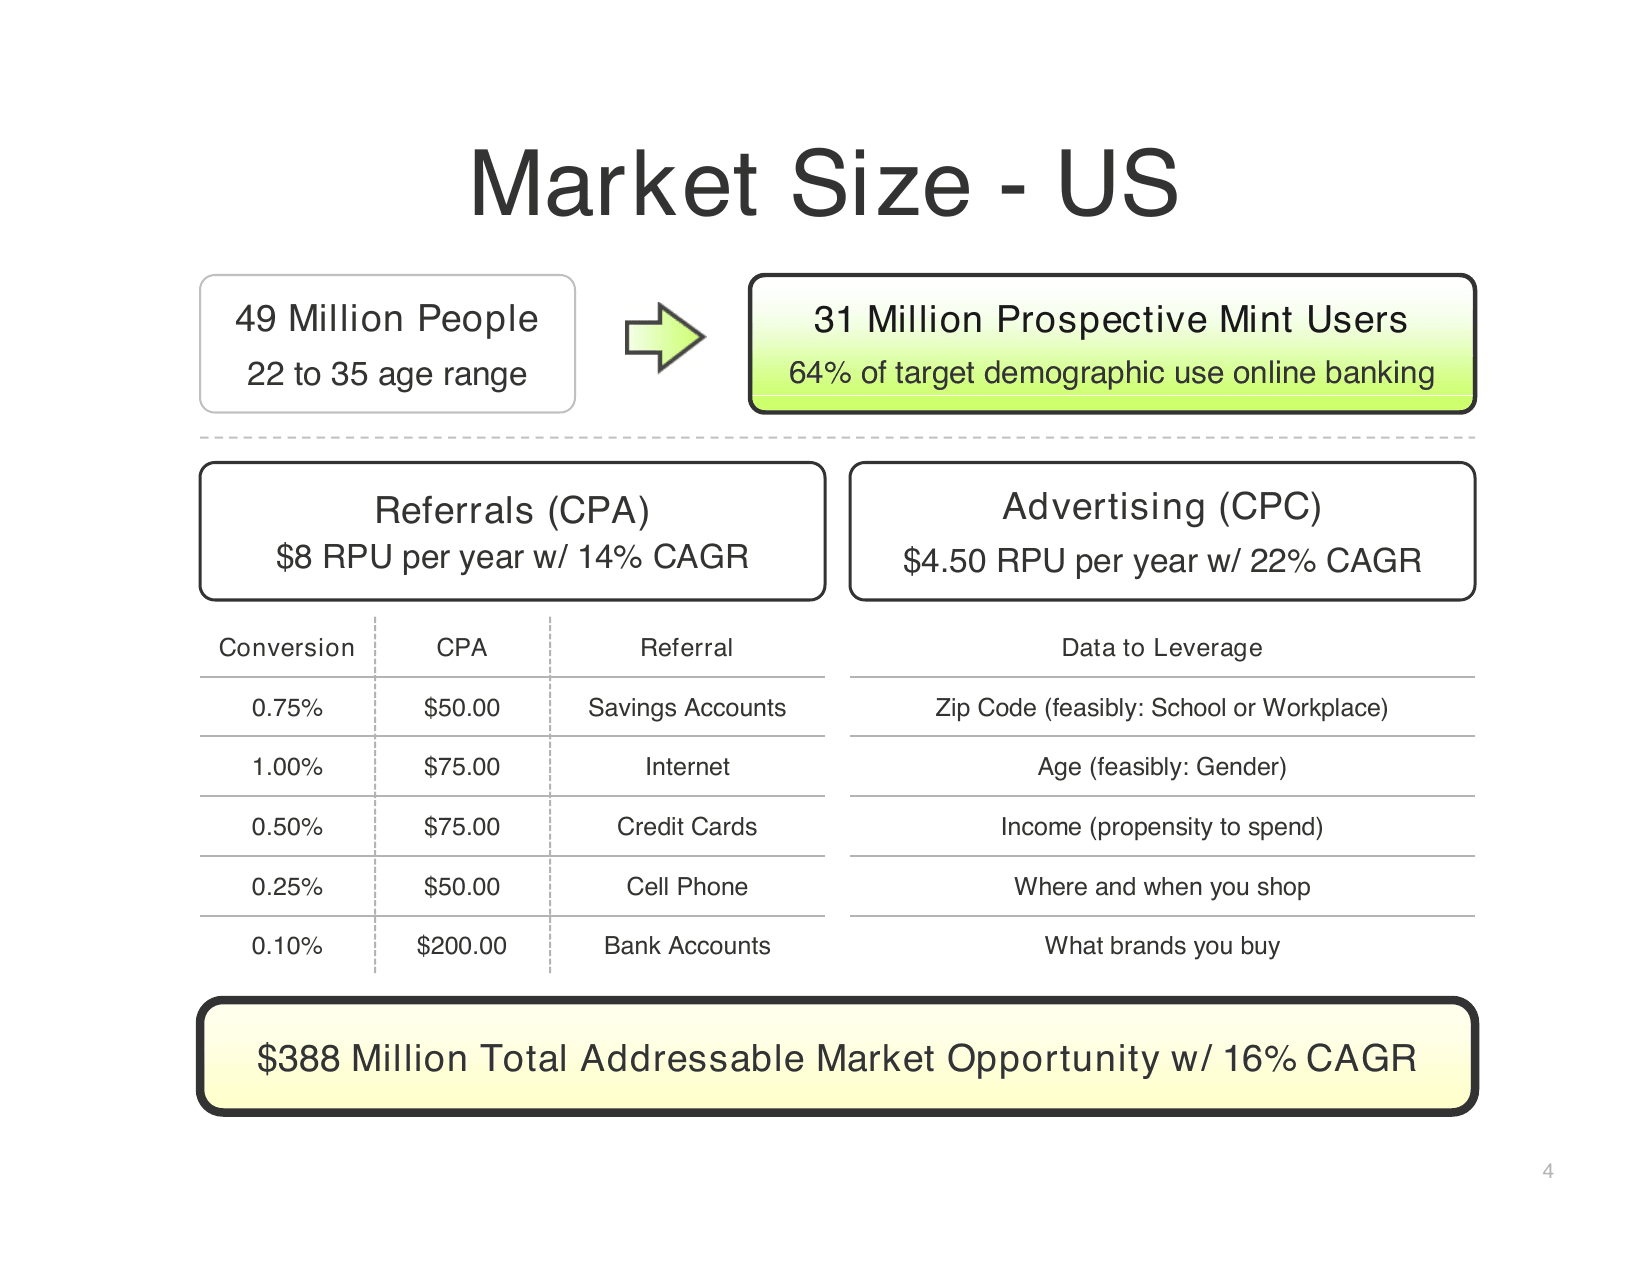
Bottom-up math beats a billion-dollar TAM slide, demographic filter, online-banking adoption rate, and two revenue lines investors can stress-test. CPA tables by product category show the model is built, not guessed.
Wesabe named as the key competitor (no revenue model, poor traction); Microsoft Money and Quicken as potential entrants. Mint counters with user-specific savings, AI auto-sorting, patents, and TurboTax integration.
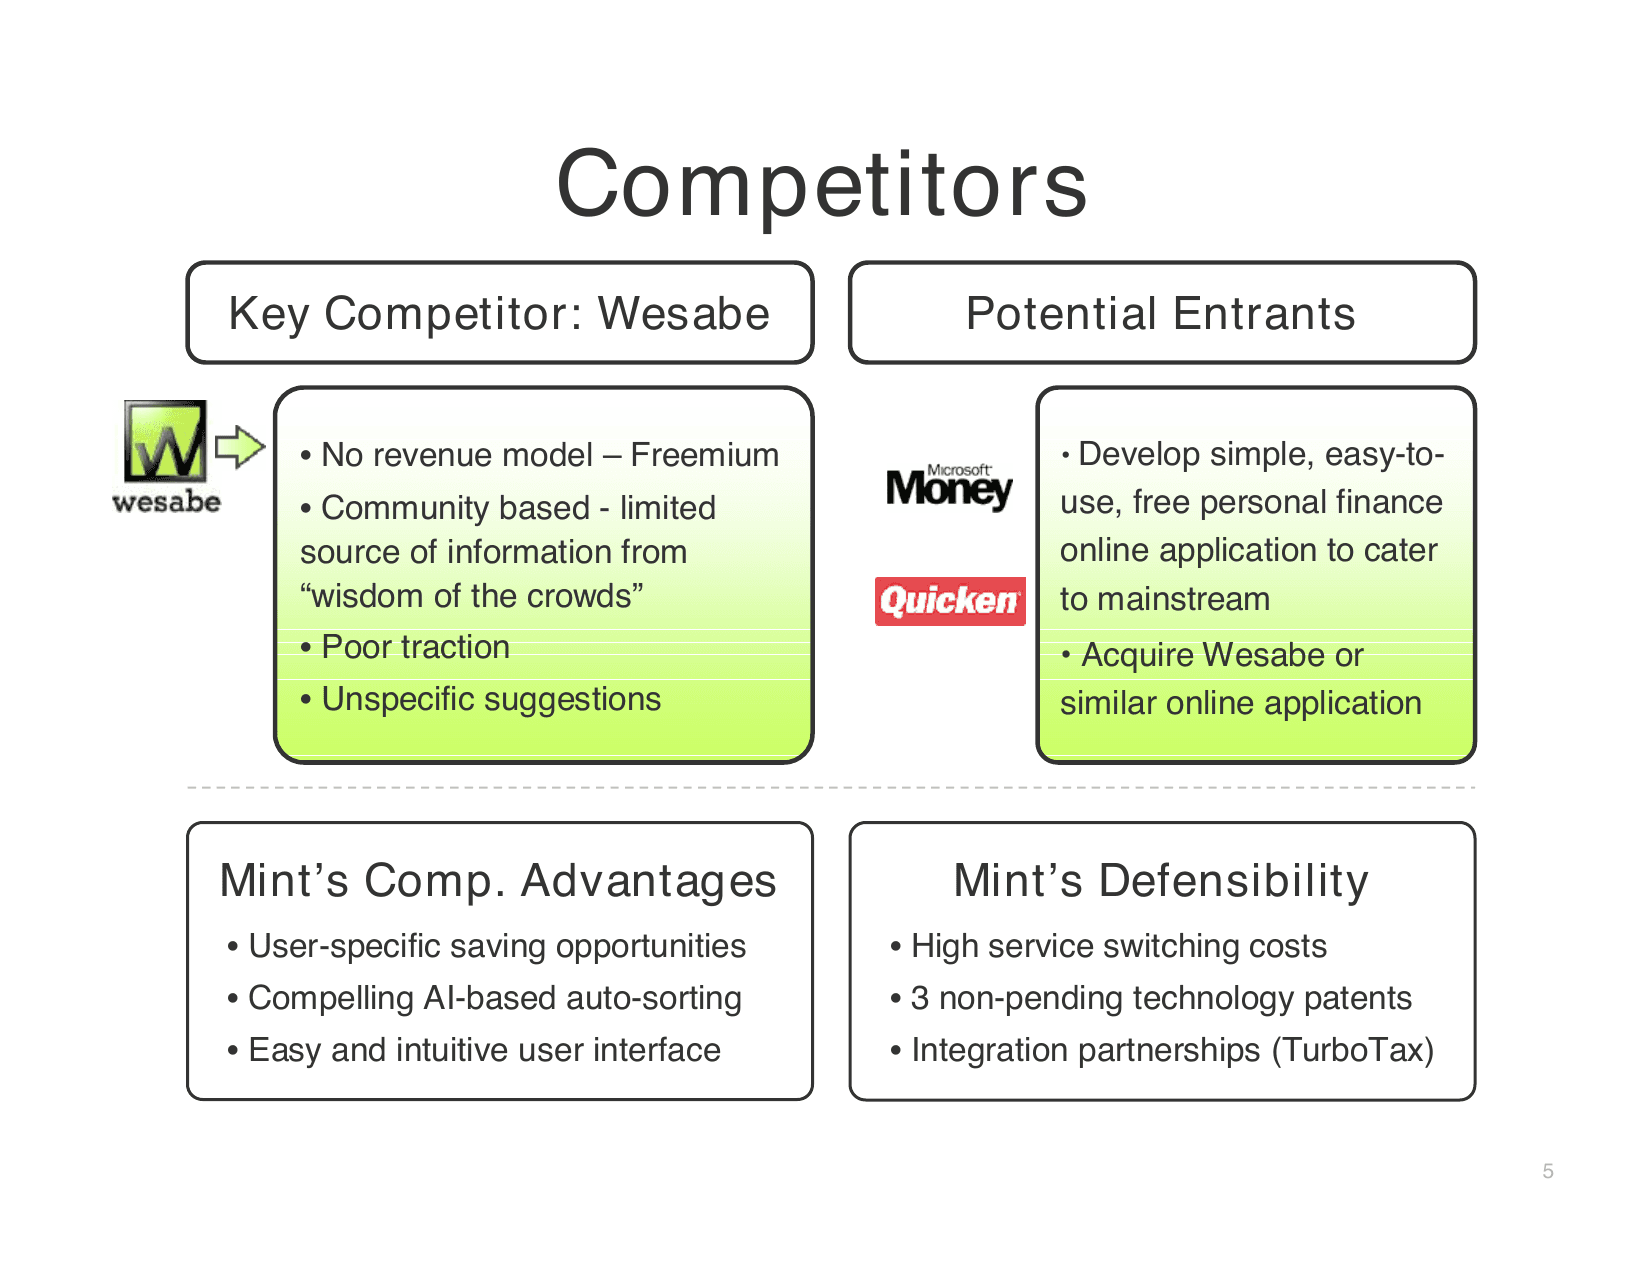
Competitive slide does double duty: dismiss the startup rival and pre-empt the incumbent threat. Switching costs and three pending patents are the moat story, not feature checklists.
Comparison grid vs finance software, online banking, and finance social networks. Mint wins on ease of use, free cost, and saving time and money.
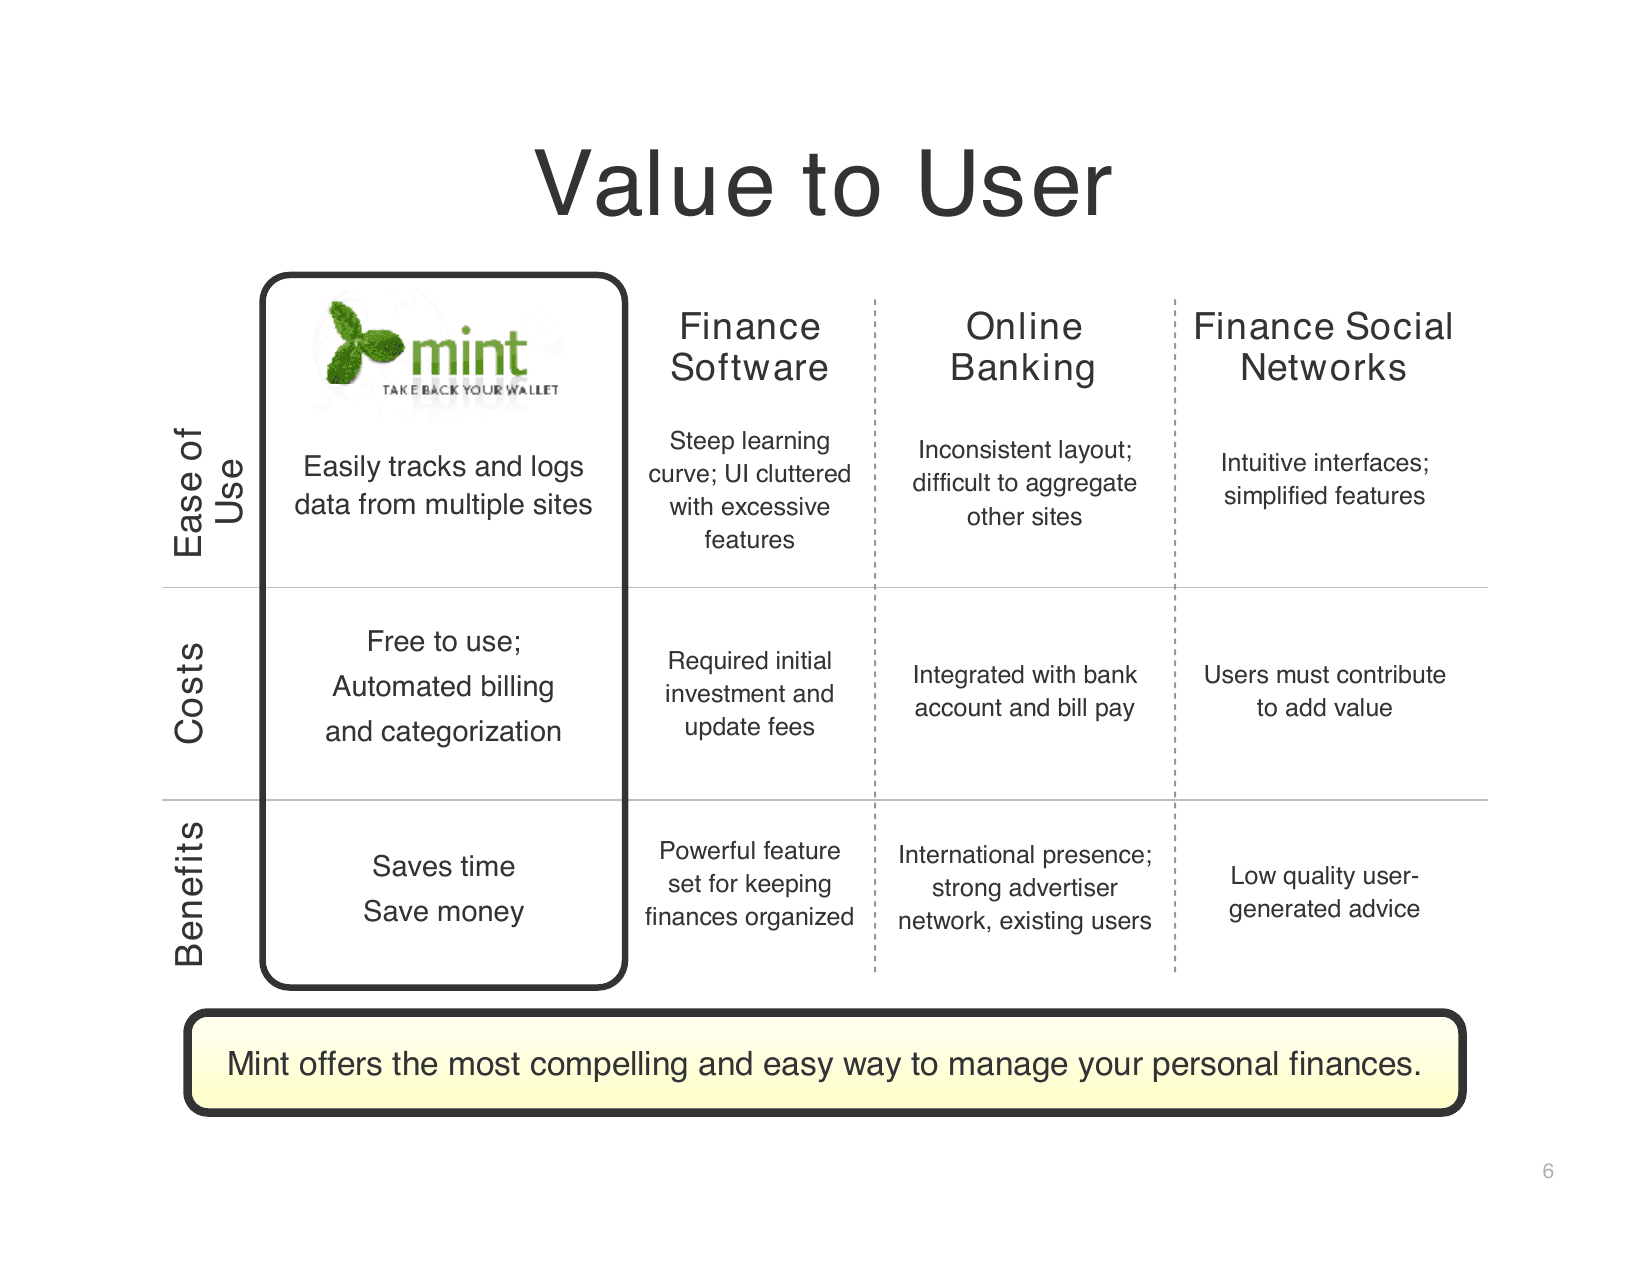
Four-column matrix positions Mint in the only quadrant that's free, automated, and personalized. The summary line. "most compelling and easy way", is bold but backed by row-by-row contrasts, not adjectives alone.
Eight named partners (WaMu, Comcast, Capital One, Cingular, Wells Fargo, E-Trade, Blue Cross, BofA). Mint referral fees run $50–$325 versus industry CAC of $150–$550, saving partners $50–$375 per customer.
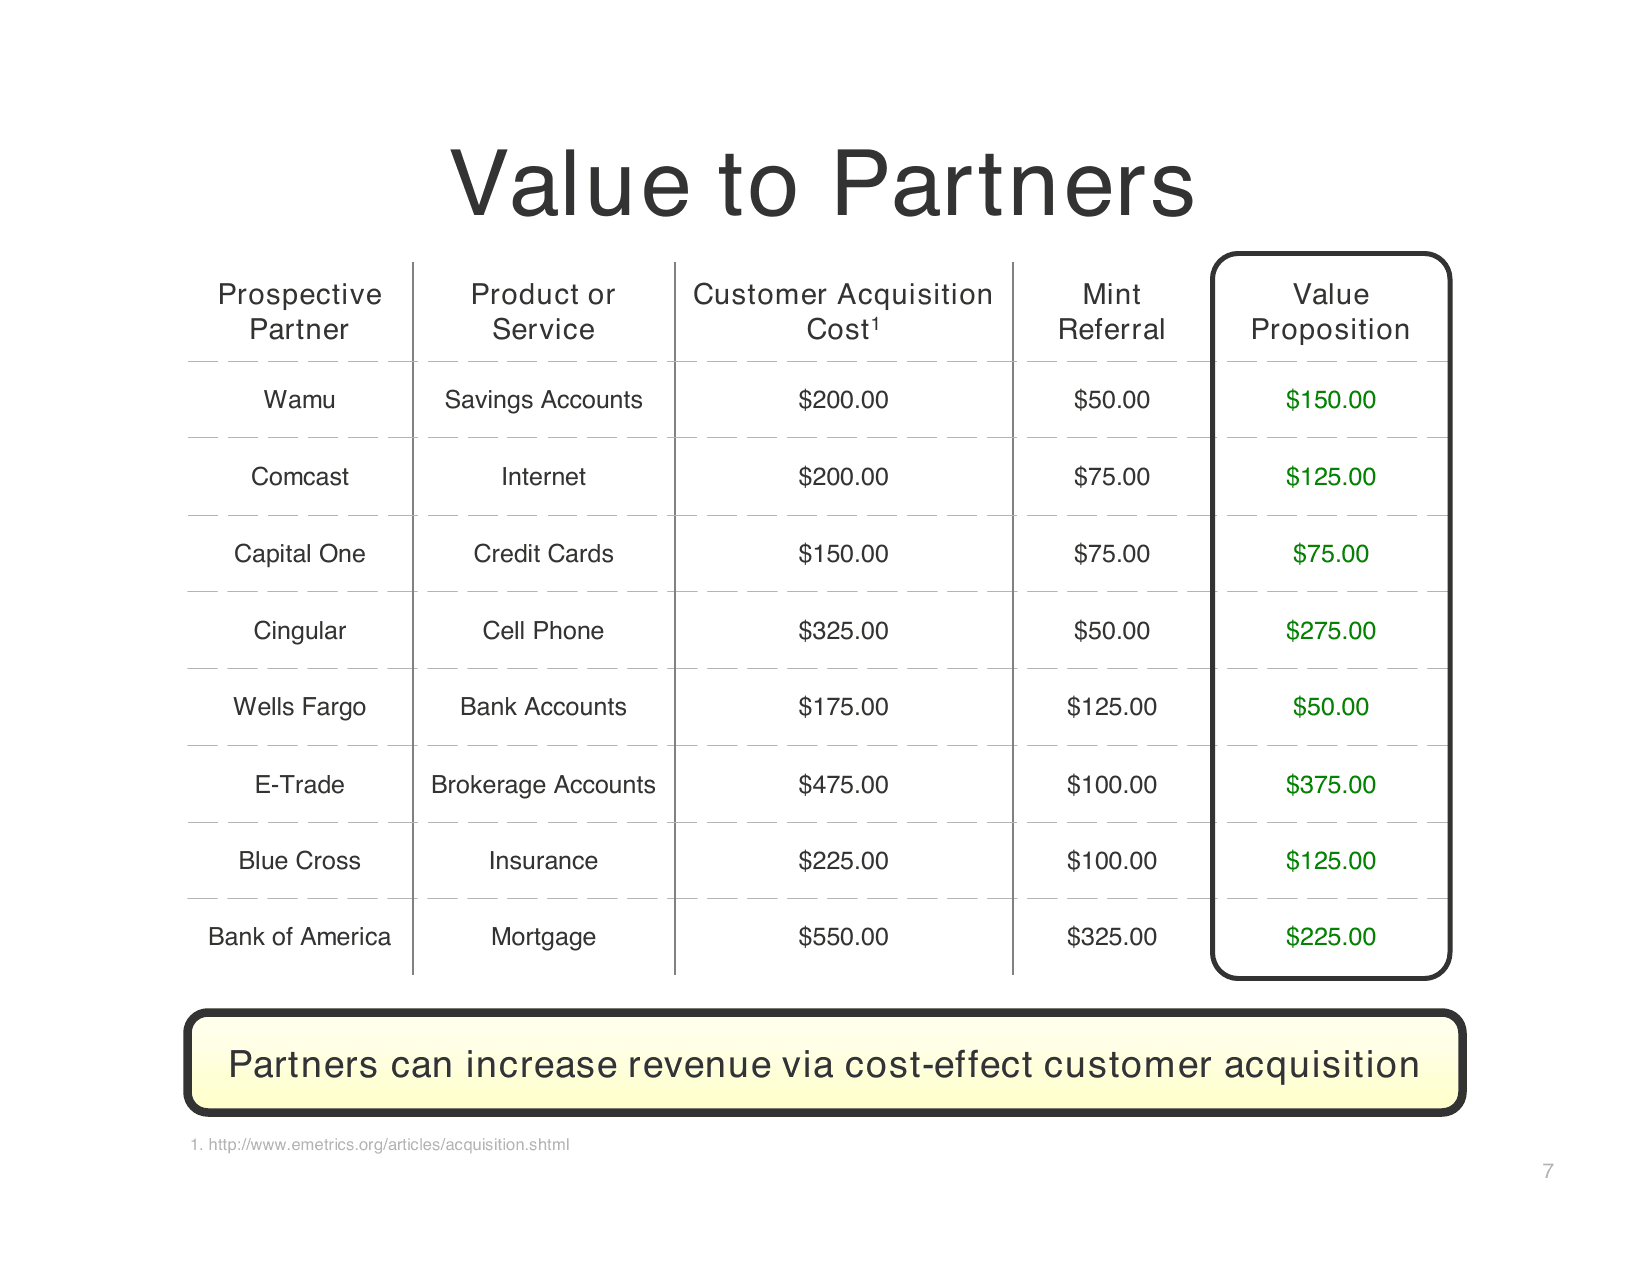
This is the slide that makes the business model credible, real company names, sourced CAC benchmarks, and a green-highlighted savings column. FinTech founders should steal this format for any affiliate or marketplace pitch.
Launch → Growth → Maturity timeline, viral badges and blogosphere tags at every stage, plus email lists, SEO, affiliate networks, PR, and Overture/AdWords.
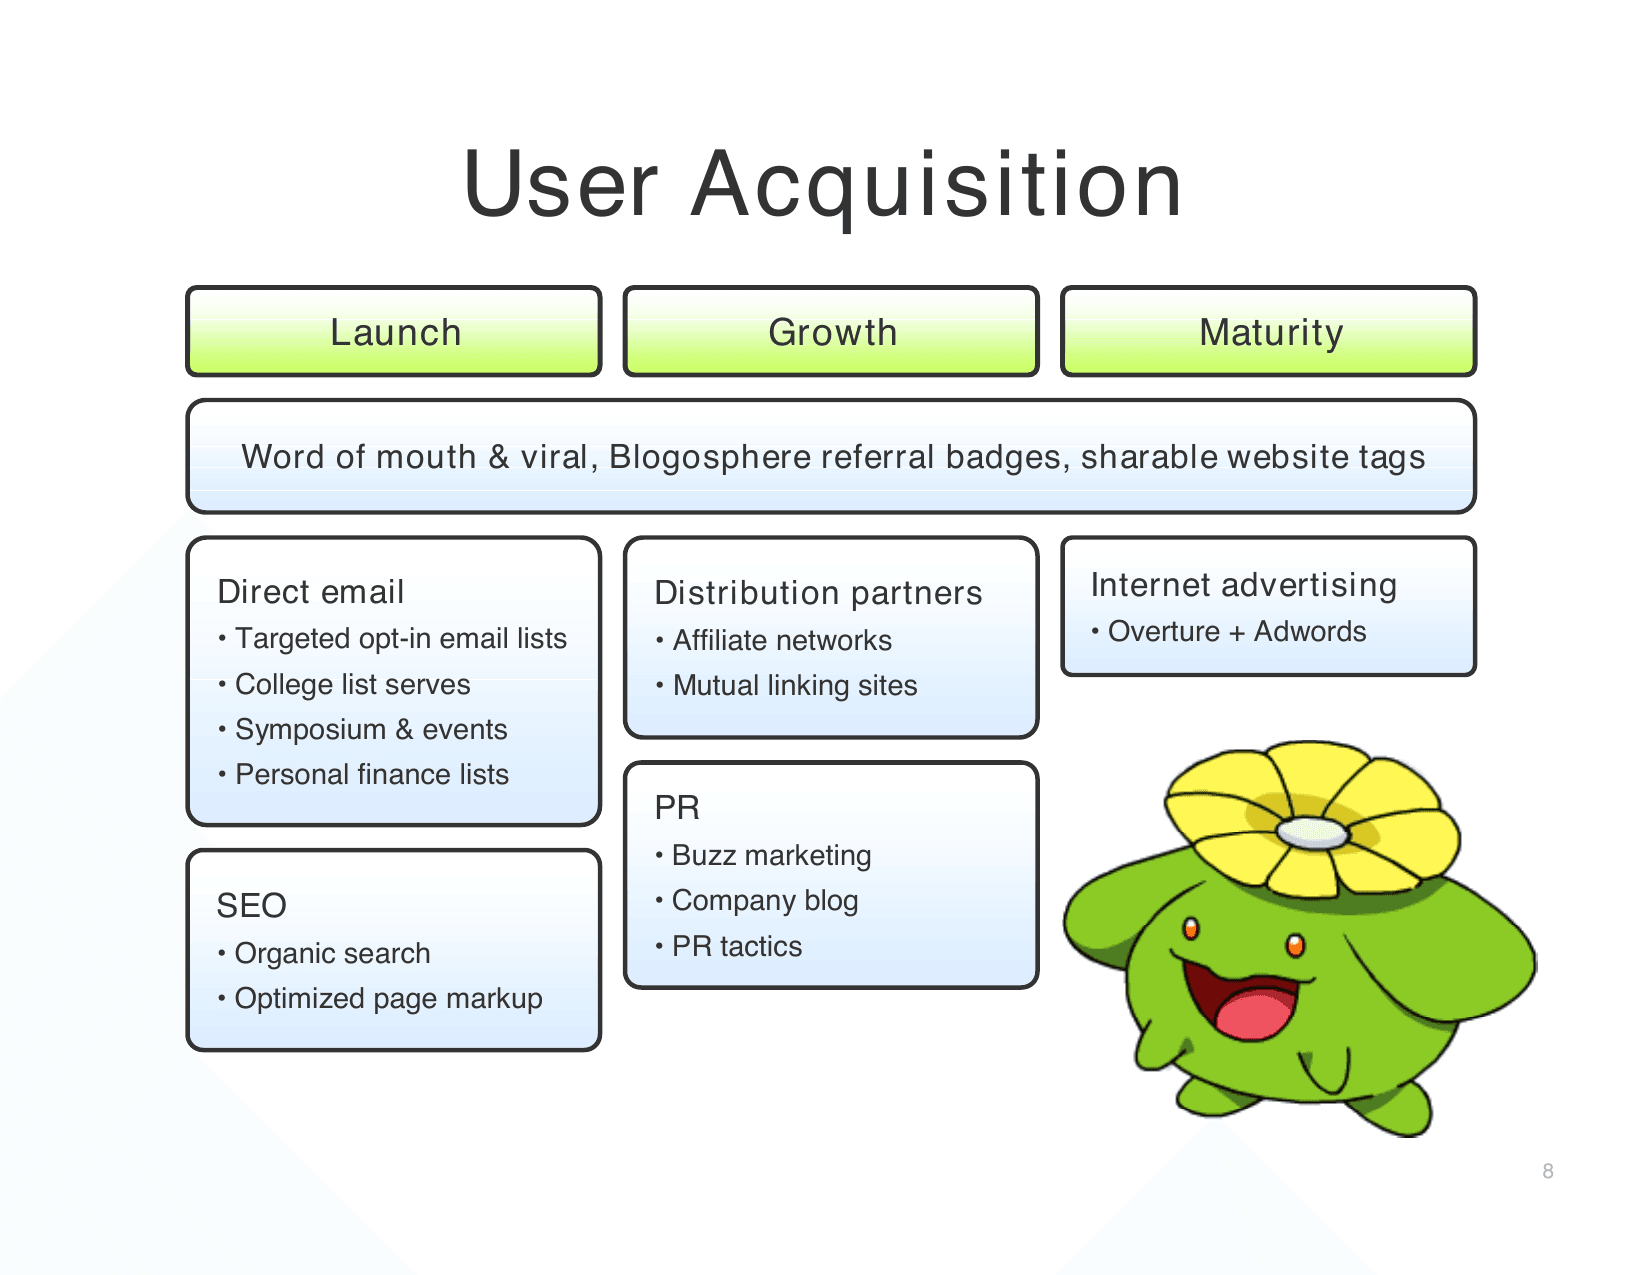
GTM spans paid and organic without overcommitting to one channel. Viral mechanics sit above the timeline. Mint planned word-of-mouth as a permanent layer, not a launch stunt.
Acquire users → gather account and spending data → deliver intelligent switch suggestions → earn referral fees on bank, credit, cell, ISP, and loan conversions; future upside from targeted ads on high-quality user data.
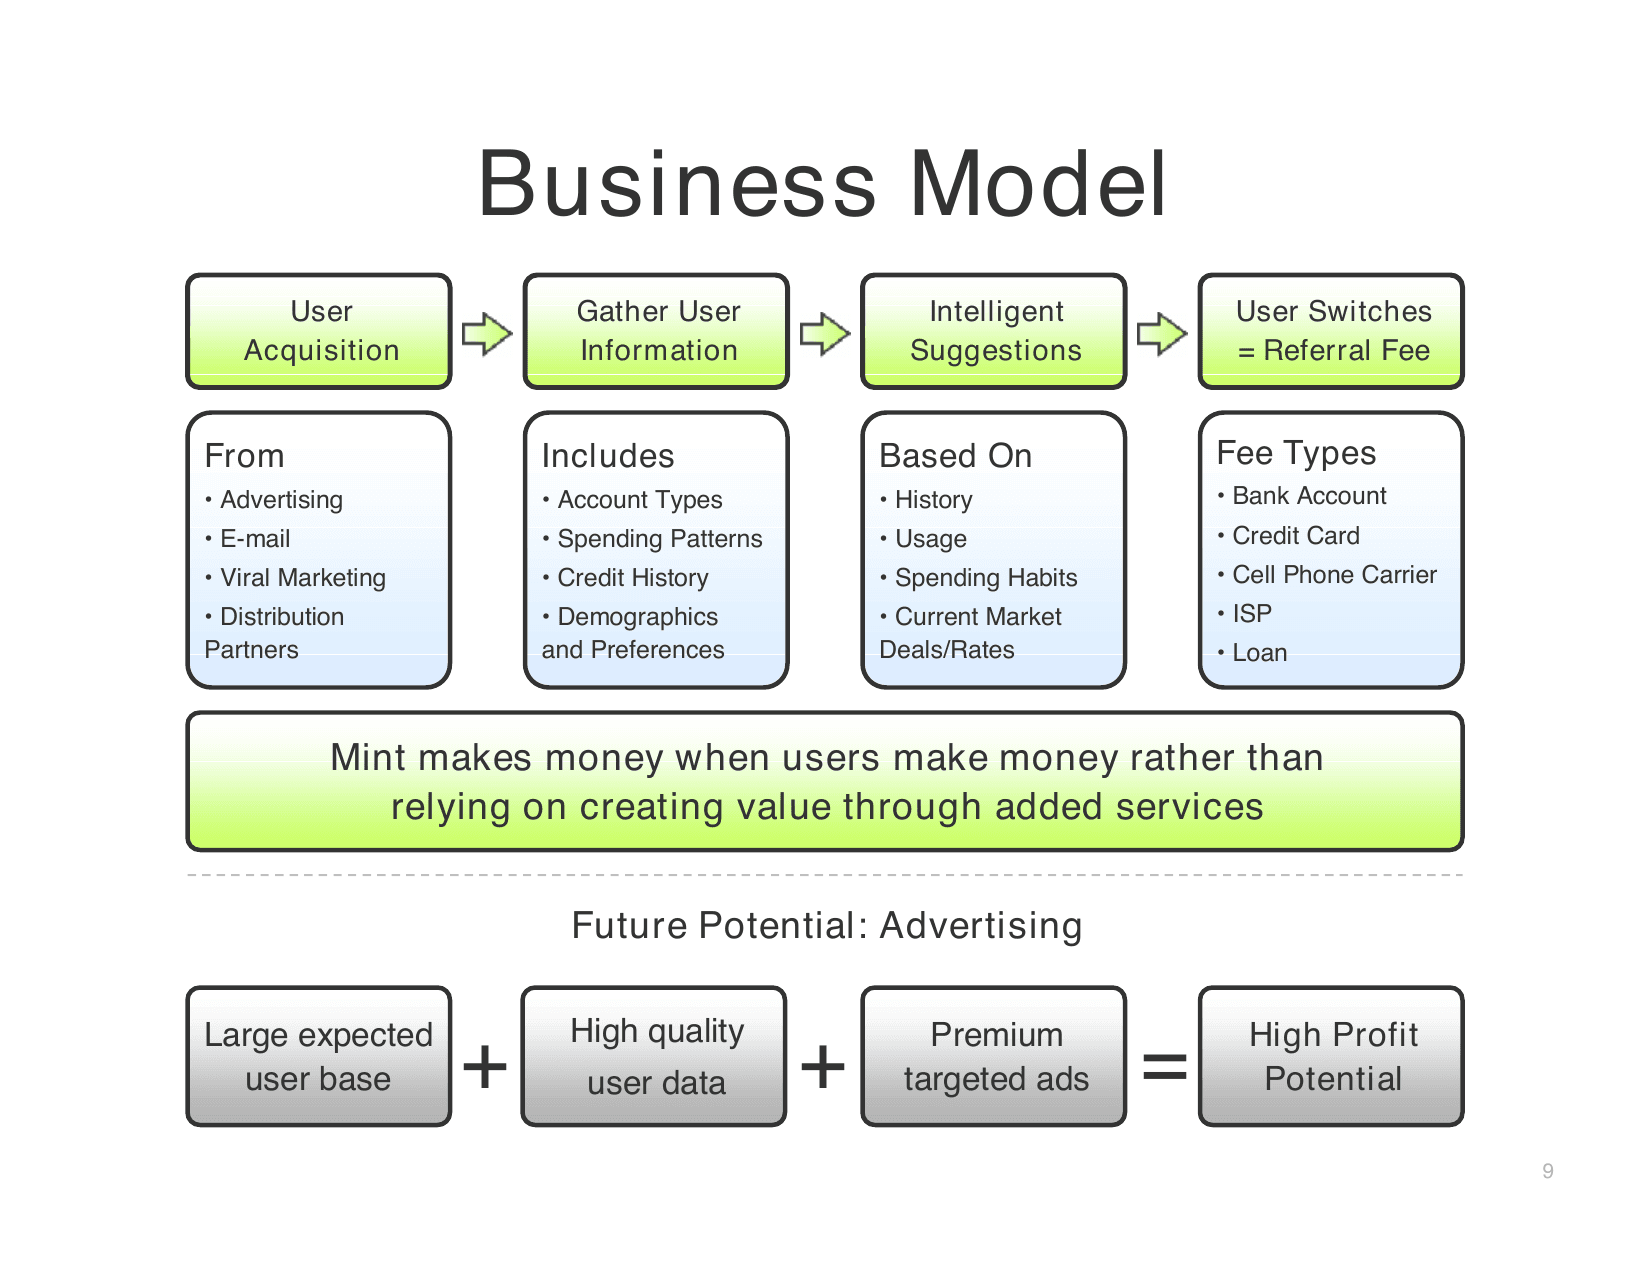
The flow diagram makes freemium logic obvious, data powers suggestions, suggestions drive switches, switches pay Mint. The banner line aligns incentives so investors don't worry about bait-and-switch monetization.
2007–2010 projections, users grow 100K to 510K, revenue $751K to $5.4M (mostly targeted advertising), EBIT turns positive at $38K rising to $2.6M; $3M investment for 15% stake at 25% IRR.
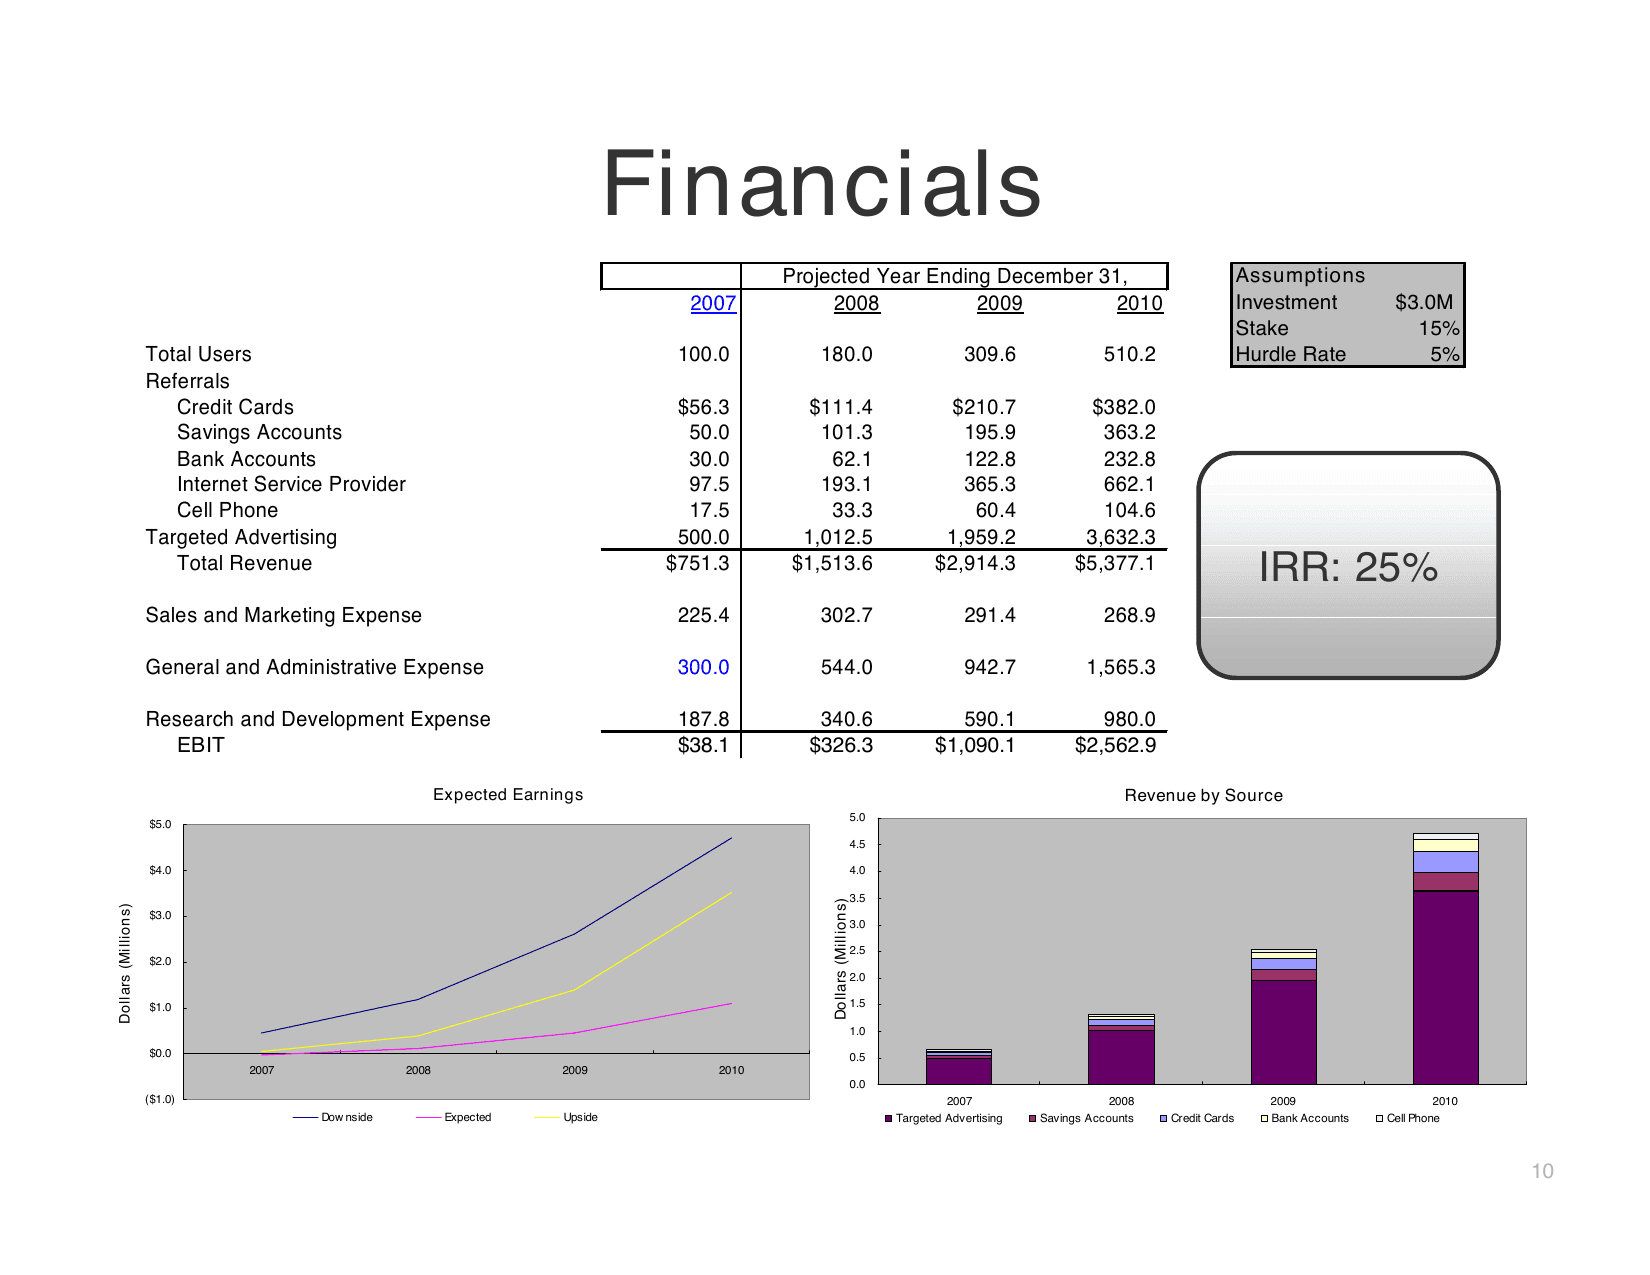
Four-year horizon keeps the model digestible. Stacked bar chart shows revenue mix shifting toward ads while referrals diversify, investors see path to scale without one partner dependency.
Four potential acquirers. Google, Yahoo, Intuit, Microsoft, each with lock-in, targeted advertising, and finance-product integration rationale.
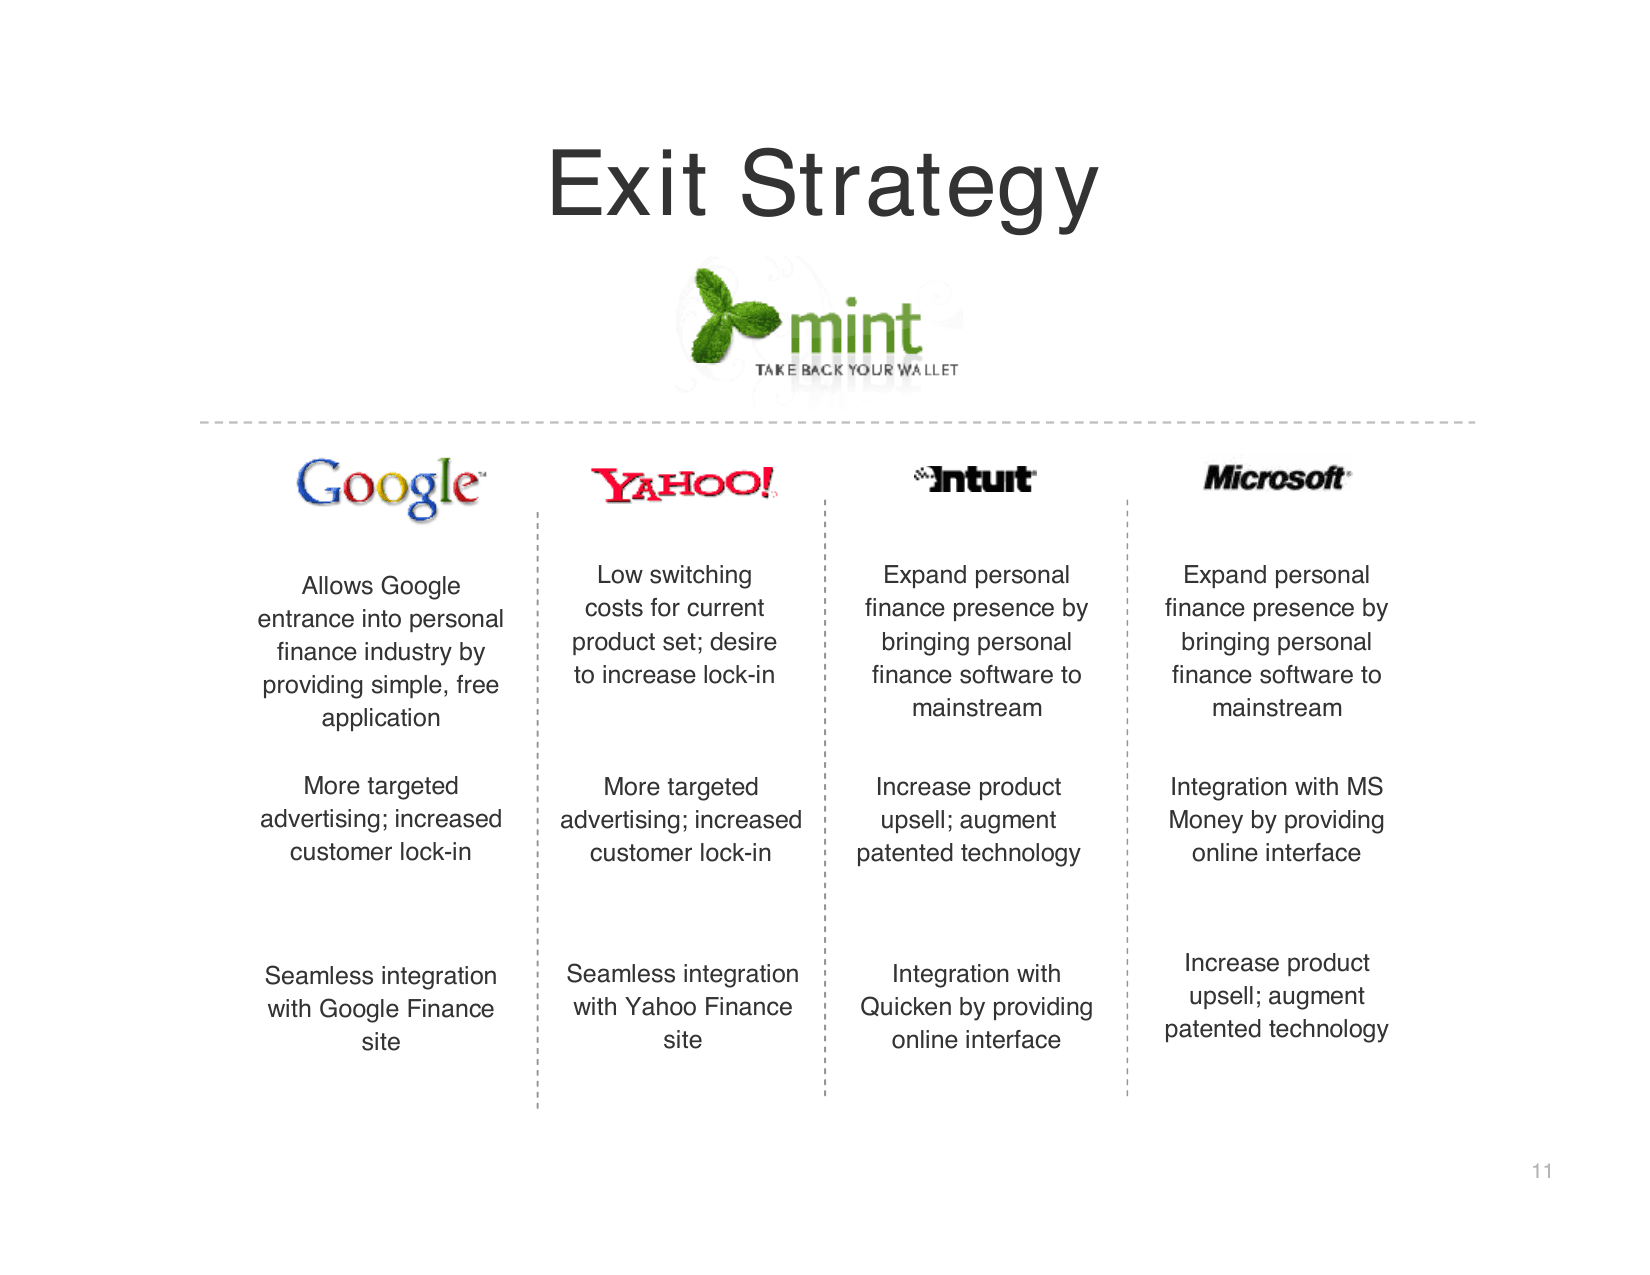
Naming four strategics with specific integration paths tells investors Patzer already thought like a portfolio manager. Intuit's bullet about bringing personal finance to the mainstream is exactly how the 2009 deal got framed.
Backup slide index. Product, Team, Market Size, Business Model, Financials, Acquirers, Risks, Product Comparisons, Revenue Streams, Management, and 5-Year Projections.
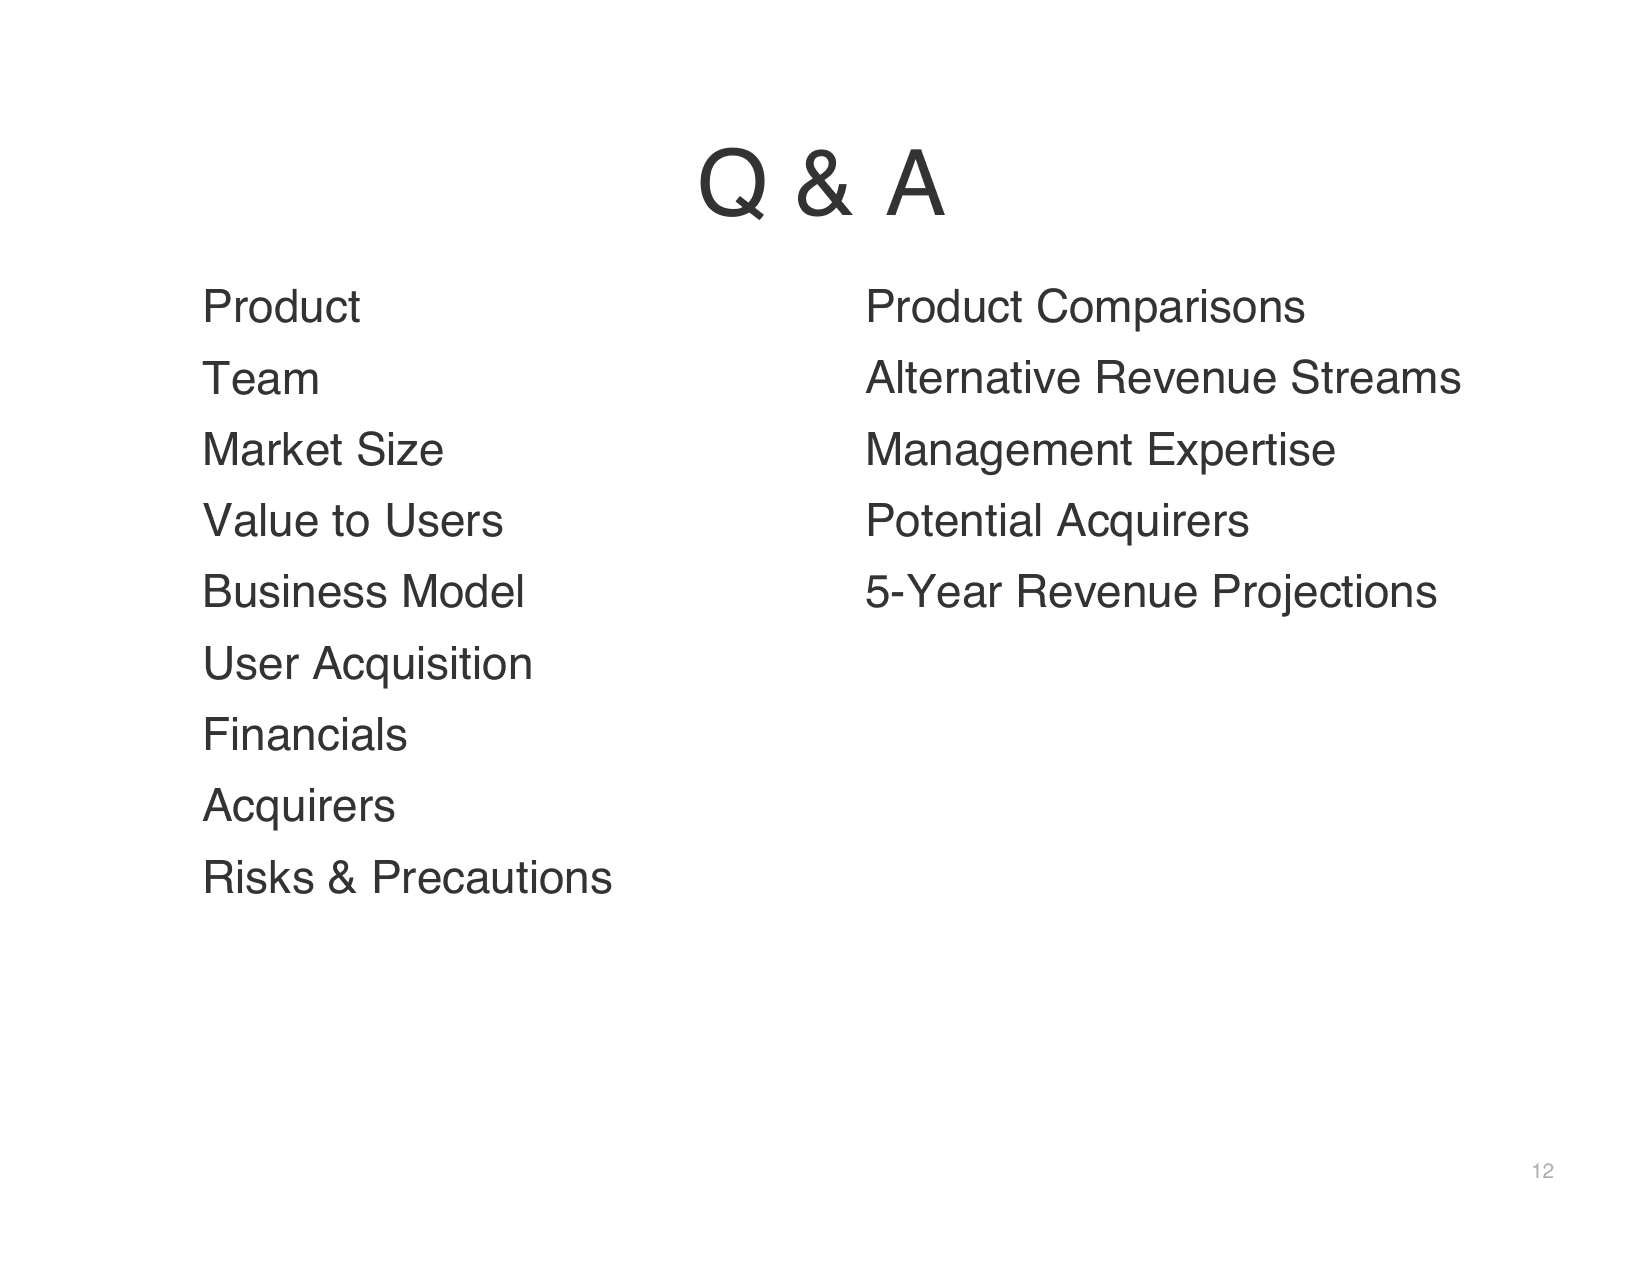
A Q&A menu signals depth without cluttering the main narrative. Founders can jump to appendix slides under investor pressure instead of flipping through blind.
Five risk–mitigation pairs, low barriers to entry (brand + patents), user commitment (high value, low time), referral rates (monetary value of suggestions), incumbent feature copy (patents + cloud architecture), slow growth (team expertise + viral potential).
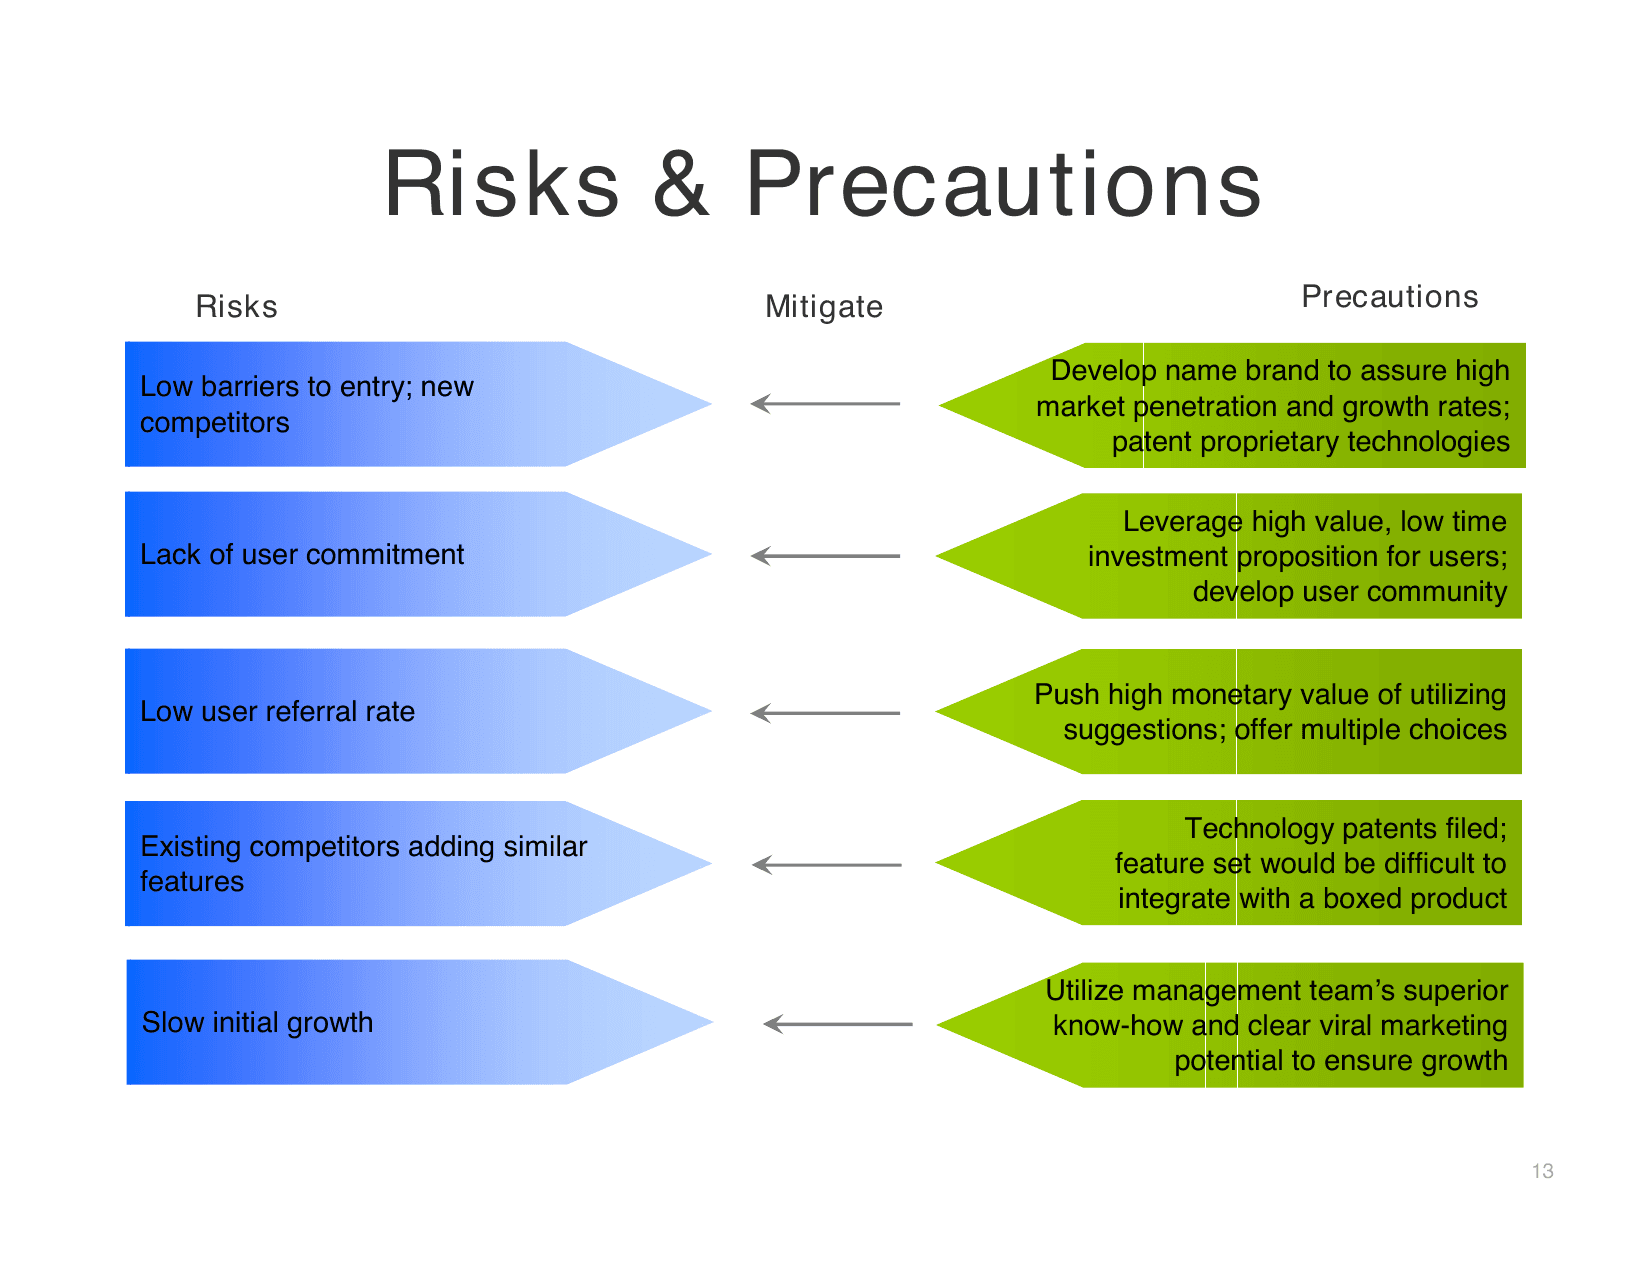
Every risk gets a specific countermeasure, not hand-waving. Acknowledging low barriers while citing patents and switching costs shows investors the team has done the defensive homework.
MyMint vs Microsoft scenario matrix, patent enforcement delays copycats, satisfied users resist brand leverage, experienced teams cancel out, and cloud aggregation extends beyond boxed Quicken.
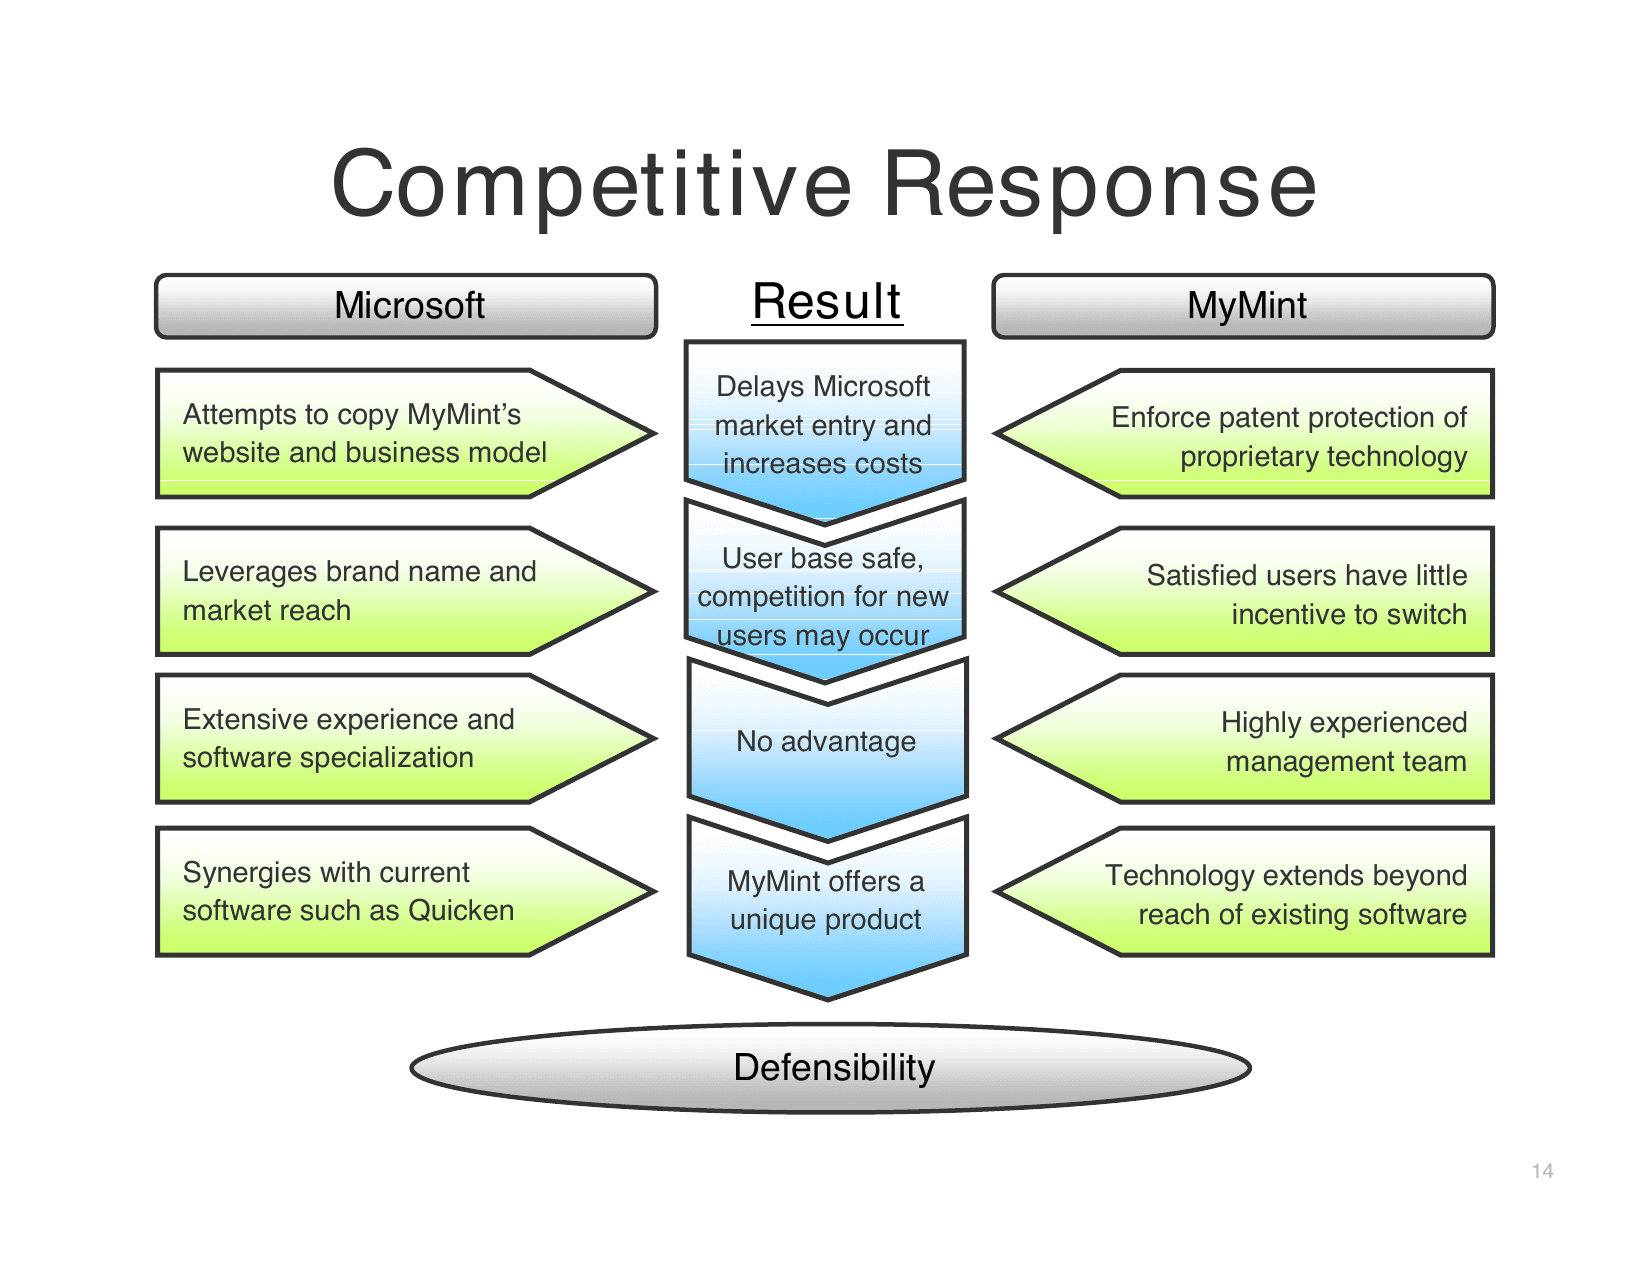
War-gaming one named incumbent (Microsoft) is more convincing than generic "what if Google enters." Each row ends in a defensibility outcome, the slide title could read "why we survive."
Model drivers, user adoption decay steps, referral conversion rates by product (credit cards 0.5–1.3%, savings 0.75–1.9%, etc.), targeted ad RPU growth, and declining S&M/G&A/R&D as percentages of revenue.
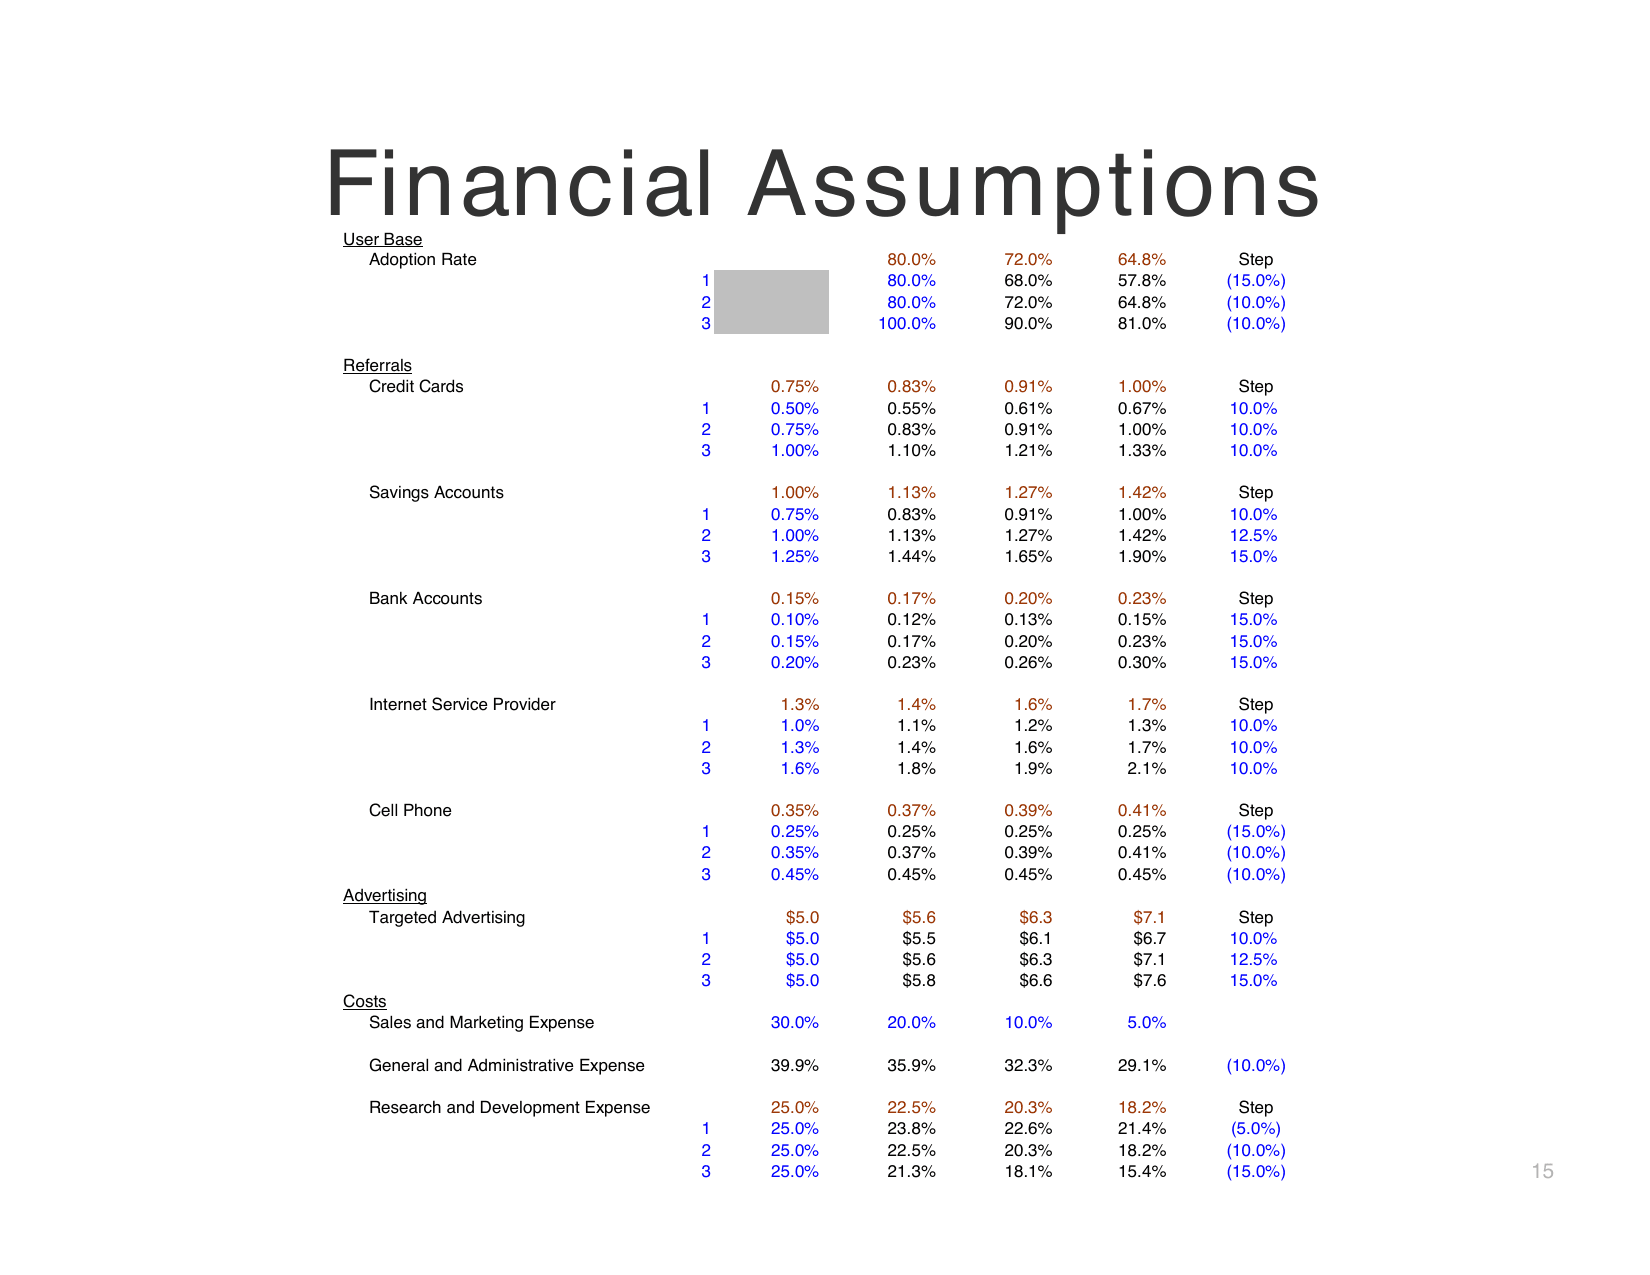
Appendix transparency for diligencing investors, every top-line number on slide 10 traces back to assumption tables here. Conversion rates by vertical show the model isn't one blended guess.
Comparable multiples from PlanetOut, DealerTrack, and Synchronoss, applied to MyMint 2007–2012 projections yield average enterprise value of $39M on $3M investment at 15% stake and 25% reinvested IRR.
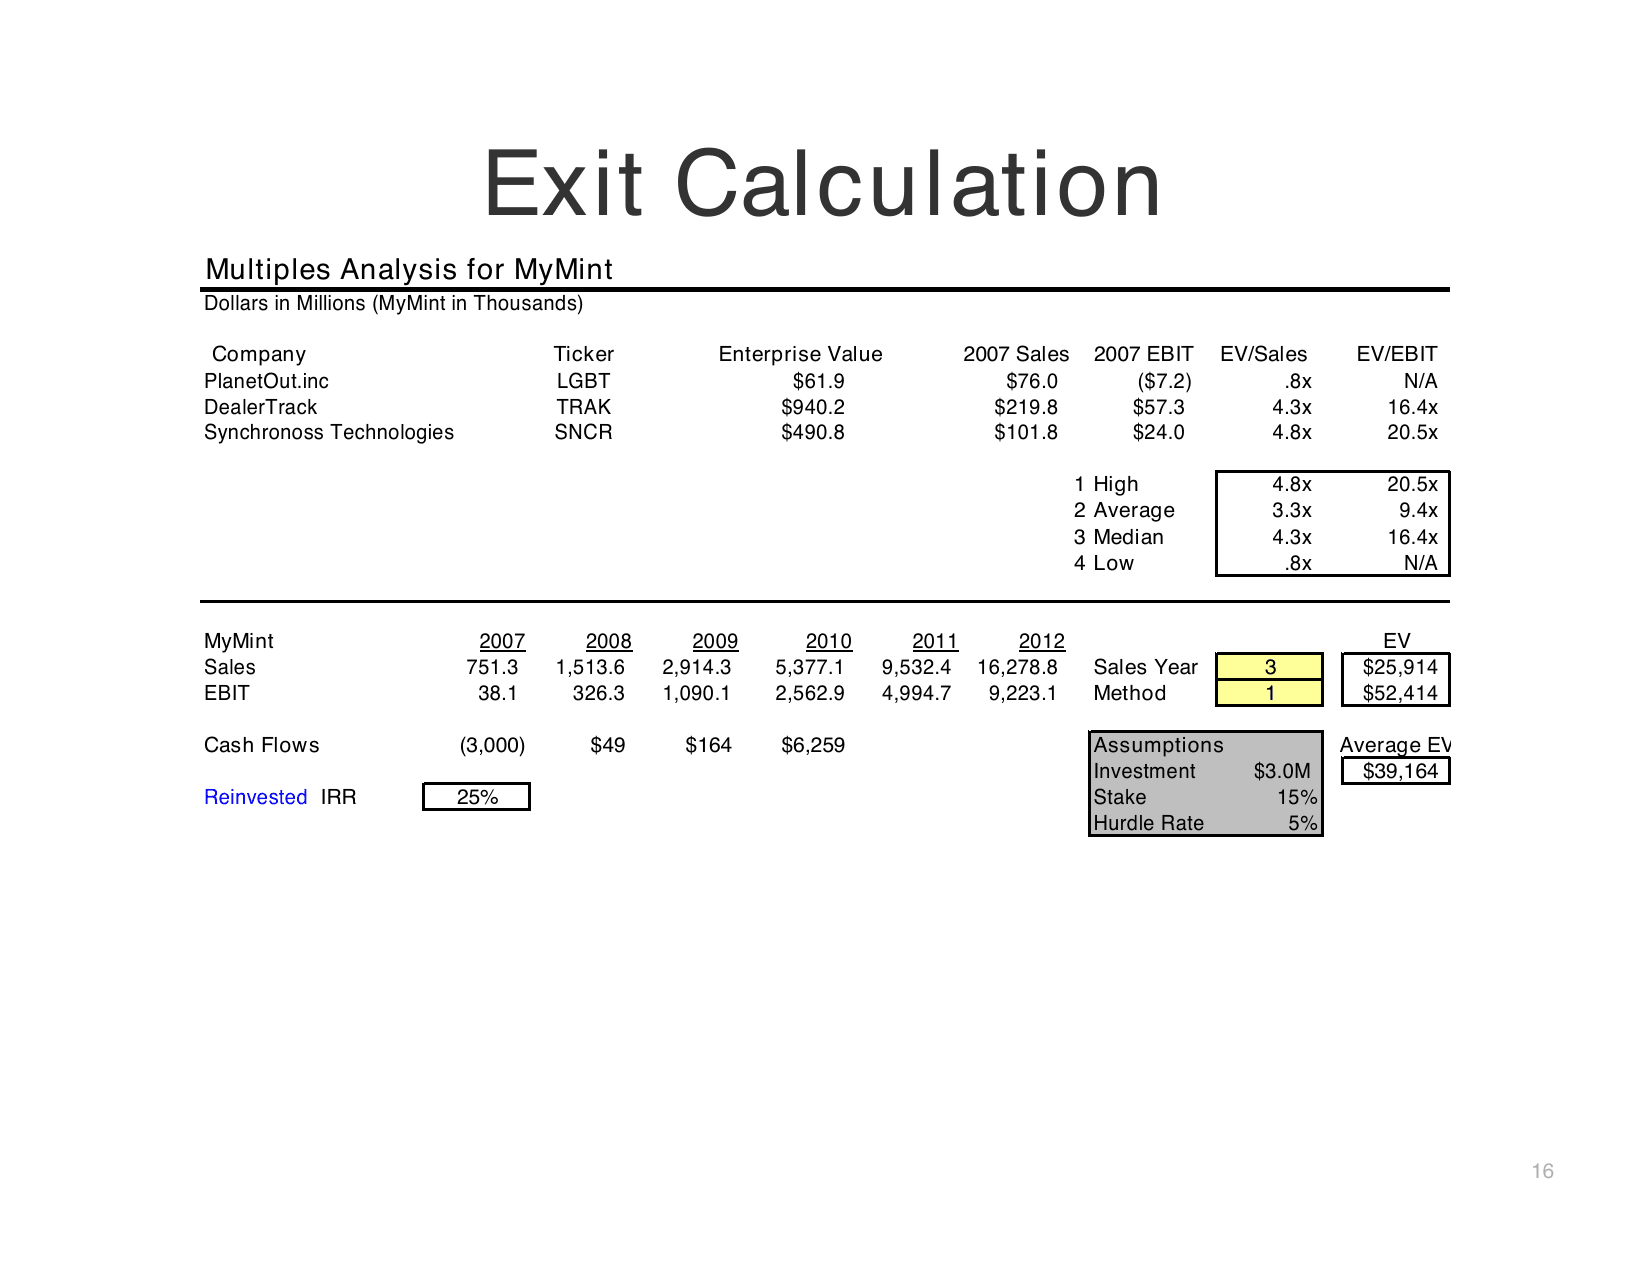
Exit math closes the loop opened on slide 11, comps, multiples, and IRR in one spreadsheet slide. Investors leave with a return scenario, not just a product story.
Join 100,000+ professionals creating presentations worth presenting.
Mint
Mint's 2007 Series A deck raised $4.7M by pitching free personal finance software when Quicken still owned the category. Aaron Patzer opened with a full product mockup, not a problem slide, then walked investors through referral economics, partner acquisition costs, and a prescient Intuit exit path. Intuit acquired Mint for $170M in 2009. This teardown covers all 16 slides, including Q&A backup and financial appendix.
Original 2007 deck · 16 slides. Click a thumbnail or scroll down for the full breakdown.
Mint logo with the tagline "Take Back Your Wallet", dated April 20, 2007.
Consumer-facing tagline on a B2B deck signals Mint knew the brand story had to feel personal, not enterprise. Investors see the consumer promise before any financials.
Full dashboard mockup, calendar bill reminders, account balances, spending pie chart, savings goals, and personalized switch recommendations for credit cards and cell plans.
Product before team or market, the deck proves the experience exists. Feature callouts for Transactions and Goals map directly to time saved and money saved, the two outcomes on the title.
Aaron Patzer (CEO), David Michaels (VP Engineering), Dave McClure (Marketing), Jason Putorti (Lead Designer), backed by First Round Capital, Felicis Ventures, Ron Conway, and Scott Cook of Intuit.
Scott Cook on the cap table is strategic foreshadowing. Intuit's founder validating a Quicken challenger. PayPal and PGP alumni on the team de-risk aggregation security and payments.
31M prospective users (64% of 49M people aged 22–35 use online banking) × $12.50 blended RPU from referrals ($8) and advertising ($4.50) = $388M TAM at 16% CAGR.
Bottom-up math beats a billion-dollar TAM slide, demographic filter, online-banking adoption rate, and two revenue lines investors can stress-test. CPA tables by product category show the model is built, not guessed.
Wesabe named as the key competitor (no revenue model, poor traction); Microsoft Money and Quicken as potential entrants. Mint counters with user-specific savings, AI auto-sorting, patents, and TurboTax integration.
Competitive slide does double duty: dismiss the startup rival and pre-empt the incumbent threat. Switching costs and three pending patents are the moat story, not feature checklists.
Comparison grid vs finance software, online banking, and finance social networks. Mint wins on ease of use, free cost, and saving time and money.
Four-column matrix positions Mint in the only quadrant that's free, automated, and personalized. The summary line. "most compelling and easy way", is bold but backed by row-by-row contrasts, not adjectives alone.
Eight named partners (WaMu, Comcast, Capital One, Cingular, Wells Fargo, E-Trade, Blue Cross, BofA). Mint referral fees run $50–$325 versus industry CAC of $150–$550, saving partners $50–$375 per customer.
This is the slide that makes the business model credible, real company names, sourced CAC benchmarks, and a green-highlighted savings column. FinTech founders should steal this format for any affiliate or marketplace pitch.
Launch → Growth → Maturity timeline, viral badges and blogosphere tags at every stage, plus email lists, SEO, affiliate networks, PR, and Overture/AdWords.
GTM spans paid and organic without overcommitting to one channel. Viral mechanics sit above the timeline. Mint planned word-of-mouth as a permanent layer, not a launch stunt.
Acquire users → gather account and spending data → deliver intelligent switch suggestions → earn referral fees on bank, credit, cell, ISP, and loan conversions; future upside from targeted ads on high-quality user data.
The flow diagram makes freemium logic obvious, data powers suggestions, suggestions drive switches, switches pay Mint. The banner line aligns incentives so investors don't worry about bait-and-switch monetization.
2007–2010 projections, users grow 100K to 510K, revenue $751K to $5.4M (mostly targeted advertising), EBIT turns positive at $38K rising to $2.6M; $3M investment for 15% stake at 25% IRR.
Four-year horizon keeps the model digestible. Stacked bar chart shows revenue mix shifting toward ads while referrals diversify, investors see path to scale without one partner dependency.
Four potential acquirers. Google, Yahoo, Intuit, Microsoft, each with lock-in, targeted advertising, and finance-product integration rationale.
Naming four strategics with specific integration paths tells investors Patzer already thought like a portfolio manager. Intuit's bullet about bringing personal finance to the mainstream is exactly how the 2009 deal got framed.
Backup slide index. Product, Team, Market Size, Business Model, Financials, Acquirers, Risks, Product Comparisons, Revenue Streams, Management, and 5-Year Projections.
A Q&A menu signals depth without cluttering the main narrative. Founders can jump to appendix slides under investor pressure instead of flipping through blind.
Five risk–mitigation pairs, low barriers to entry (brand + patents), user commitment (high value, low time), referral rates (monetary value of suggestions), incumbent feature copy (patents + cloud architecture), slow growth (team expertise + viral potential).
Every risk gets a specific countermeasure, not hand-waving. Acknowledging low barriers while citing patents and switching costs shows investors the team has done the defensive homework.
MyMint vs Microsoft scenario matrix, patent enforcement delays copycats, satisfied users resist brand leverage, experienced teams cancel out, and cloud aggregation extends beyond boxed Quicken.
War-gaming one named incumbent (Microsoft) is more convincing than generic "what if Google enters." Each row ends in a defensibility outcome, the slide title could read "why we survive."
Model drivers, user adoption decay steps, referral conversion rates by product (credit cards 0.5–1.3%, savings 0.75–1.9%, etc.), targeted ad RPU growth, and declining S&M/G&A/R&D as percentages of revenue.
Appendix transparency for diligencing investors, every top-line number on slide 10 traces back to assumption tables here. Conversion rates by vertical show the model isn't one blended guess.
Comparable multiples from PlanetOut, DealerTrack, and Synchronoss, applied to MyMint 2007–2012 projections yield average enterprise value of $39M on $3M investment at 15% stake and 25% reinvested IRR.
Exit math closes the loop opened on slide 11, comps, multiples, and IRR in one spreadsheet slide. Investors leave with a return scenario, not just a product story.
Join 100,000+ professionals creating presentations worth presenting.