

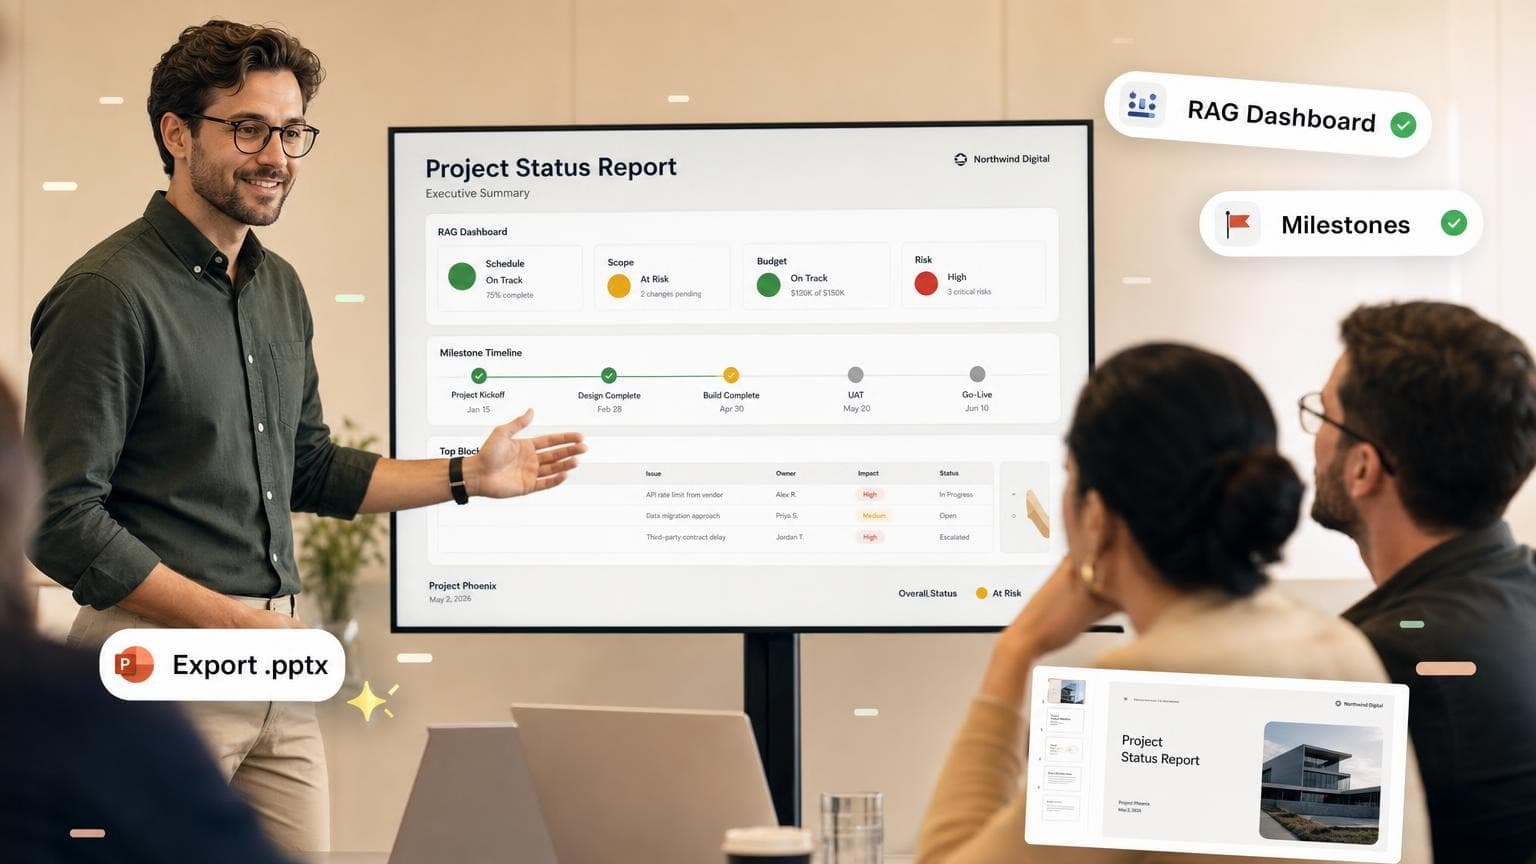
A project status report template gives your weekly steering meeting the same spine: what changed, what's blocked, what you need from leadership. You paste a wall of bullets into PowerPoint or rebuild the deck from scratch every Friday.
This outline fits a 15–20 minute readout for product, engineering, or client delivery work. Drop sections you skip (budget, change requests). Keep one slide per decision the room must make.
For deck basics, see What Is a Slide Deck?. To turn a written status doc into slides, read PDF to PowerPoint with AI.
- Use 8–10 slides for a weekly or biweekly status readout; move detail to an appendix or speaker notes - Lead with RAG status (Red / Amber / Green) on schedule, scope, budget, and risk so executives scan in seconds - One slide per theme: milestones, blockers, decisions needed, next period plan - Paste your status email or export from Jira/Asana into GenPPT when the facts are in writing - Match slide count to your slot with how many slides per minute
What belongs in a project status report deck
Your status deck answers four questions for sponsors and cross-functional partners:
- Are we on track? (schedule, scope, budget)
- What shipped since last readout?
- What could derail us?
- What do you need from the room this week?
Email and Confluence status reports cover the same ground. On slides you pick hierarchy: headlines up front, detail in notes or appendix.
Project status report template (8 slides)
Copy this order. Rename slides to match your PMO language.
Add slides 9–10 as an appendix when finance or legal need backup tables. Present the summary live; leave row-level tables in the appendix.
Slide 3: RAG dashboard example
Define RAG once in your PMO wiki. Reuse the same thresholds each week. When labels change week to week, sponsors trust the dashboard less than an honest red status.
Slide 6: Blockers that earn a slide
List blockers that need action outside the team:
- Vendor contract unsigned → legal review stalled 10 days
- Headcount not approved → critical path role open
- Dependency team missed handoff → blocks QA start
Put everything else in speaker notes or the tracker link.
Build the deck from a written status report
You have the content in email, Notion, or a Word export. Skip retyping bullets slide by slide.
Manual path
- Drop each section from your status doc into the matching slide placeholder
- Replace paragraphs with headline + 3 bullets max per slide
- Add PowerPoint speaker notes for numbers and names you might forget under pressure
- Export or share as
.pptxfor stakeholders on Microsoft 365
AI path (GenPPT)
- Upload your status PDF, Word doc, or paste the weekly update at /app/new
- Prompt: "Turn this into a 10-slide project status report for executives. Include RAG dashboard, milestones, blockers, and decisions needed."
- Approve the outline before design runs
- Pick a visual concept, generate, export
.pptx - Fact-check dates, RAG colors, and dollar figures before you present
For the full AI workflow, see How to Create a PowerPoint with AI. For free vs paid template tradeoffs, browse best PowerPoint templates.
Common mistakes
Use what makes a good presentation as a pre-read checklist before high-stakes steering meetings.
Frequently asked questions
How many slides should a project status report have?
8–10 slides for a 15–20 minute executive readout. Internal team updates can run 5–6 slides if you skip budget and appendix material.
What is RAG in project reporting?
Red, Amber, Green traffic-light status on schedule, scope, budget, or risk. Green means on track. Amber means watch or minor slip. Red means intervention needed. Define thresholds once; apply them the same way each week.
Can I use Google Slides instead of PowerPoint?
Yes. The same outline works in Google Slides. If your org mixes both, see Google Slides vs PowerPoint before you pick a primary editor.
Can AI build a status report from my Jira export?
Yes, if you export or paste a readable summary (PDF, Word, or plain text). AI restructures prose into slides. You still own RAG calls, dates, owners, and dollar amounts. Verify each one before you present.
Where do detailed metrics go?
Appendix slides or speaker notes. The live deck stays scannable. Sponsors ask follow-up questions; speaker notes hold the backup tables.
Ship this week's readout
Open your last status email. Map each section to the 8-slide table above. If the update is written, upload it to GenPPT, lock the outline, and export PowerPoint before the steering committee meets.