
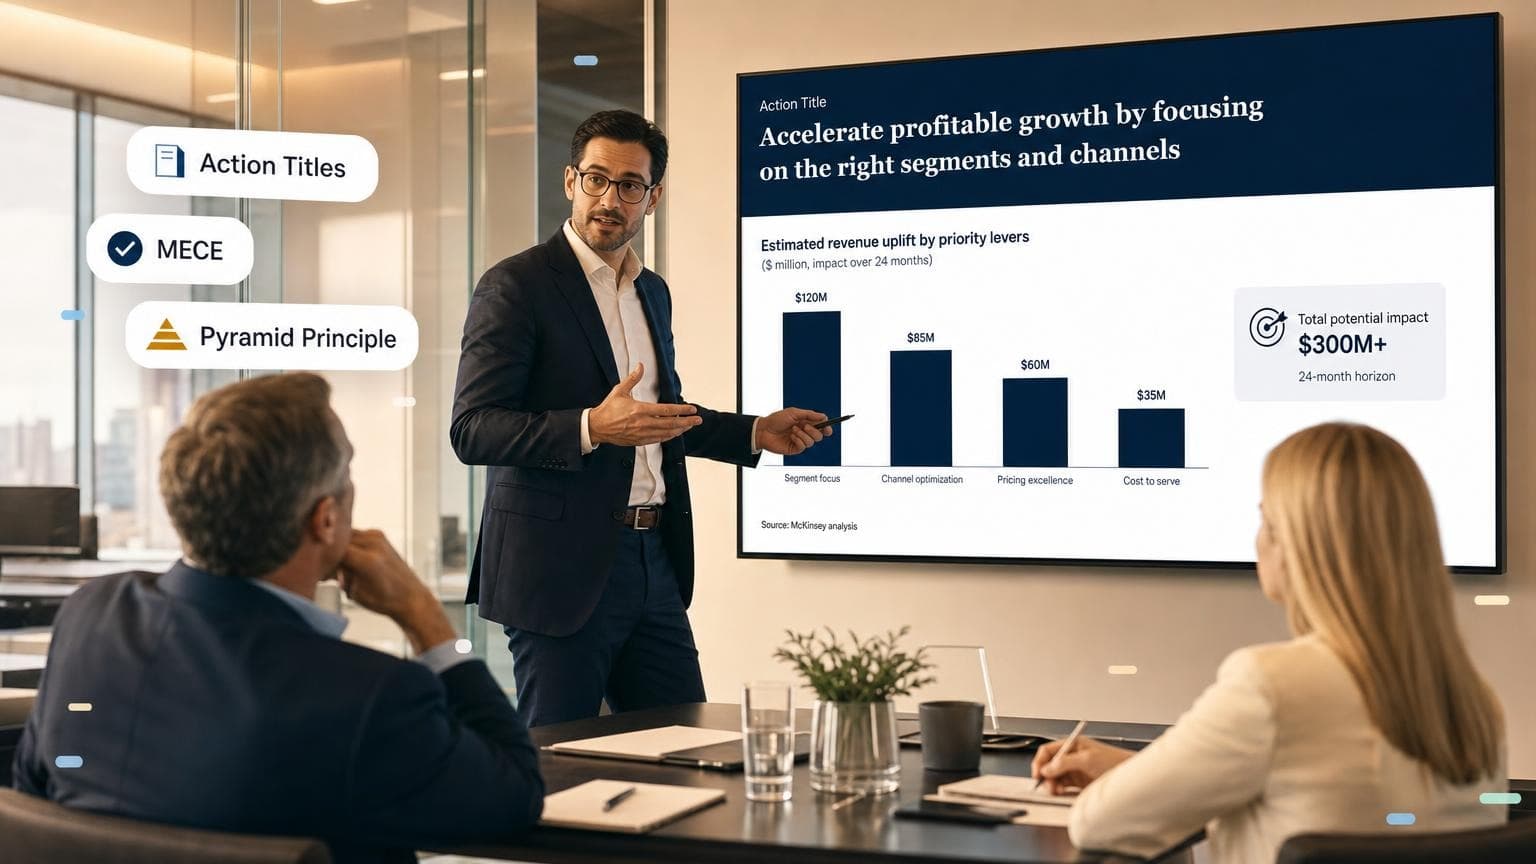
McKinsey slides put the recommendation on slide 2 and use full-sentence action titles that state a finding, not a topic label. Barbara Minto codified the structure at McKinsey in the 1960s–70s: Pyramid Principle, MECE sections, and SCR storylines. Analysts build bottom-up; executives read top-down.
Your steering committee already knows the company. They want a decision, not a research tour. Move anything that does not change the decision to the appendix.
This guide includes:
- Real McKinsey slide examples from a public 2024 webcast deck
- A downloadable consulting template PDF (8 slides, fill-in placeholders)
- The full reference webcast PDF for study
- A copy-ready 8-slide outline you can run through GenPPT
For deck basics, see What Is a Slide Deck?. For executive readouts with RAG status, see our project status report template.
Download: McKinsey-style templates
McKinsey slide generator
Enter your recommendation → copy prompt or generate a full consulting deck in GenPPT
Consulting deck template
Preview all 8 slides, copy the default GenPPT prompt, download PDF
Consulting deck template PDF
Blank 8-slide structure with placeholders
McKinsey “Transforming for growth” webcast
Real published McKinsey deck. Study action titles and chart discipline
GenPPT prompt (copy and paste)
Use this at GenPPT or in the McKinsey slide generator. Attach the template contact sheet as a style reference for navy/white consulting visuals.
Consulting-style strategy deck (McKinsey-style slides).

Structure requirements:
- Lead with the recommendation on the executive summary slide (Pyramid Principle: answer first)
- Use action titles: every slide headline is a complete sentence stating the insight, not a topic label
- MECE sections: mutually exclusive, collectively exhaustive groupings
- SCR storyline: Situation → Complication → Resolution
- One message per slide; one primary chart per slide
- Source footnote on every exhibit

Slide order (8-slide main path):
1. Cover: [Engagement title], [Client], [Date]
2. Executive summary: governing recommendation + 3–5 complete-claim bullets
3. Situation: stable context with baseline KPI chart
4. Complication: what broke the status quo (waterfall or bridge)
5. MECE overview: three levers that cover the full opportunity
6. Evidence: single chart proving key line 1
7. Competitive positioning: 2×2 matrix with defensible axes
8. Recommendations: numbered verb-led actions + next steps table (owner, deliverable, date)

My engagement:
- Audience: [Board / steering committee / client leadership]
- Governing recommendation: [State your answer in one sentence]
- Context: [Industry, company, decision at stake]

Visual style: navy and white executive palette, minimal decoration, large headline type, generous whitespace, professional consulting layout. Match the attached reference contact sheet for typography and density.- Put the governing recommendation on the executive summary slide (slide 2), not at the end. - Write action titles as full sentences (Costs grew 10% while revenue grew 5%), not topic labels (Cost overview). - Every slide: action title → subheading → exhibit, plus a source footnote. - Group proof with MECE sections; run the read-through test on titles alone before you design charts. - Download the 8-slide template PDF or paste the outline into GenPPT.
Real McKinsey slide examples (2024 webcast)
The examples below come from McKinsey's public "Transforming for growth" webcast (November 14, 2024). Published McKinsey material, not a leaked client deck. Use it to study current action-title and chart standards.
Cover slide: minimal, client-facing
McKinsey cover slides stay sparse: title, presenters or client, date. No agenda on the cover. No chart thumbnails.
Action title + stacked bar: one chart, one message
This slide demonstrates the consulting 1-3-1 rule: one key message, up to three supporting points in the exhibit, one clear visual.
The action title states the finding: "Growth begins in the core and top growers expand beyond the core to drive growth." The subheading defines the data: "Share of total revenue growth, N=1,874." The stacked bars prove the title: core revenue dominates in every industry shown.
Compare a weak version of the same slide:
The weak title forces the reader to interpret the chart. The action title tells them what to see before they look at the bars.
MECE framework slide: mutually exclusive buckets
Consultants use framework slides to show MECE structure before diving into proof. This slide groups growth levers into three pathways (core, adjacencies, breakout) under one cultural aspiration: each bucket is distinct, together they cover the growth agenda.
Numbered list slide: scannable executive read
When the exhibit is qualitative (mindsets, practices, recommendations), McKinsey uses numbered blocks with short verb-led phrases. The action title still carries the governing thought; the list proves it.
Sensitivity matrix: data proves a specific claim
Consulting charts match the comparison you need, not decoration. This matrix shows implied share price across revenue CAGR and EBITDA margin combinations. The action title explains why the exhibit exists: using an external lens to set growth ambition.
Venn + puzzle frameworks: visual MECE
When the argument is structural ("prioritize based on X, support through Y"), consultants use simple diagrams with restrained color. Two frameworks on one slide works only when both support the same action title.
Download the full 18-slide webcast PDF →
The five-part McKinsey deck structure
Most consulting deliverables follow the same spine. Slide counts flex by engagement size; the sections stay stable.
Slideworks (ex-MBB consultants) note that final client readouts often run 20–40 main-path slides with an appendix longer than the main deck. Public research decks (MGI, webcasts) can be shorter: the 2024 growth webcast is 18 slides.
Section 1: Cover slide
Keep three elements: project name (under ~8 words), client or audience, date. Optional: confidentiality label. McKinsey decks are sometimes branded client-facing (client logo, client template) or firm-facing (McKinsey template) depending on how the client wants to socialize the work.
Section 2: Executive summary
The executive summary slide (sometimes called "At a glance") is the slide partners spend the most time refining. It carries the governing thought, one sentence stating what the audience should believe or do.
Below the governing thought, add 3–5 bullets. Each bullet is a complete claim:
Executive summary bullets should mirror the action titles of the next five body slides, in order. The summary becomes a table of contents written as conclusions.
Section 3: Body
The body holds quantitative and qualitative proof. Break it into 3–5 MECE sections. Each section starts with a section divider whose title is the section conclusion.
Within a section, one message per slide. For competitive positioning, the 2×2 matrix from our competition slide guide fits McKinsey-style argumentation when your axes are defensible.
Section 4: Recommendations and next steps
Recommendations are specific and verb-led:
Group recommendations when you have more than five. Label groups (Quick wins / Structural / Enablers). Write in active voice starting with verbs: Grow…, Reduce…, Target…, Accelerate…
The next steps slide assigns owner, deliverable, and date. Skip vague "further analysis" rows.
Section 5: Appendix
The appendix holds Q&A ammunition: cohort cuts, survey toplines, model tabs, interview quotes. McKinsey presenters skip it in the live read unless asked. Reference appendix slides from footnotes on body slides ("See A-14 for full cohort cut").
Slide anatomy, 1-3-1, and the read-through test
Every consulting slide has three required parts plus a footer:
┌─────────────────────────────────────────────────────────┐
│  ACTION TITLE (complete sentence = the insight)         │
│  Subheading: what data proves the title                 │
├─────────────────────────────────────────────────────────┤
│                                                         │
│  EXHIBIT (chart, table, framework: one message)        │
│                                                         │
├─────────────────────────────────────────────────────────┤
│  Source: [footnote]                    McKinsey & Co  5│
└─────────────────────────────────────────────────────────┘
Rules:
- Nothing in the action title that the exhibit does not support
- Nothing in the exhibit that the action title does not need
- Subheadings add scope: "US market, $ billions, 2020–2025" or "Forecasted battery cost by 2030 ($/kWh)"
Print or view slide titles only, in order. You should know the recommendation by the end, and each title should follow from the last. If someone has to read the chart aloud to explain the point, rewrite the title or split the slide.
Pyramid Principle: answer first, then prove
Barbara Minto's Pyramid Principle stacks ideas in three levels:
              [Governing recommendation]
                     /    |    \
          [Key line 1] [Key line 2] [Key line 3]
             /  \         |           /  \
       [Evidence] [Evidence] ...   [Evidence]
Top level: the answer you want approved.
Middle level: 3–5 supporting arguments (MECE).
Base level: data, charts, quotes, and analysis proving each argument.
Minto's line: "You think from the bottom up, but you present from the top down." Most analysts want to walk through the journey. Executives want the destination, then the map.
Worked example: margin recovery deck
Governing thought (executive summary title): "Acme should prioritize pricing and mix to recover 200 bps margin by FY27."
Key lines (MECE):
- Discount depth, not volume, is the primary margin driver
- Three levers can recover margin without exiting mid-market
- Implementing all three levers yields 200 bps by FY27
Evidence slides (sample action titles under key line 1):
- Revenue grew 8% but margin compressed as discounting outpaced volume
- Competitors undercut list price 15–22% in mid-market segments
- Discount depth correlates with churn: low-churn accounts tolerate 4–6% list increases
Each evidence slide is one row in the pyramid base. Scan those three titles in order. The logic should hold without the charts.
SCR and SCQA: the consulting storyline
Where the Pyramid Principle structures arguments, SCR and SCQA structure narrative flow.
SCR (Situation → Complication → Resolution)
SCQA (adds an explicit Question)
Insert a Question after the complication: "How do we protect share without destroying margin?" Use SCQA when the audience might disagree on problem framing before they hear the answer.
Action titles
An action title is a slide headline written as a complete sentence that states the slide's takeaway.
From the 2024 webcast (actual titles):
- "Leaders use a holistic growth blueprint to achieve sustained profitable growth"
- "Growth begins in the core and top growers expand beyond the core to drive growth"
- "5 practices consistently underpin growth transformation outperformers"
Action titles state a claim. Topic titles state a category. Claims give executives something to approve or push back on.
How to write action titles
- Finish the exhibit first (or sketch it). What is the one number or pattern that matters?
- Write the "so what" as a complete sentence with a subject and verb
- Replace vague words ("significant," "various") with numbers or comparators
- Read adjacent titles in sequence. If the flow breaks, rewrite before you touch chart colors
If you cannot write a crisp action title, the slide probably mixes two ideas. Split it.
MECE: organize the body without gaps or overlap
MECE (Mutually Exclusive, Collectively Exhaustive) is the consulting rule for grouping ideas:
- Mutually exclusive: each bucket belongs in one place only
- Collectively exhaustive: together, the buckets cover everything relevant
Example: cost reduction deck:
MECE applies to section structure, bullet groups, and chart breakdowns. Overlapping pie segments invite a challenge in Q&A.
McKinsey vs BCG vs Bain: same logic, different emphasis
All three MBB firms share conclusions first, action titles, appendix discipline. Style differs:
You do not need firm-branded templates to apply the logic. Pick one palette, one font pair, and enforce action titles.
Ghost deck: structure before design
Consultants build a ghost deck first: every slide title in final order, placeholder boxes for exhibits, no polished design.
Workflow:
- Write the governing thought for the executive summary
- List 3–5 key lines that support it (MECE)
- Under each key line, draft action titles for proof slides
- Add recommendation and next steps titles
- Run the read-through test
- Only then design charts and pick layouts
Partners sometimes sketch sections on paper, then build empty slides with titles only, print them, and lay them on a table to check horizontal flow. PowerPoint Slide Sorter view works the same way.
This mirrors how GenPPT separates outline approval from visual generation.
Charts and design rules
Pick the chart for the comparison you need:
Design rules:
- One message per chart; two messages means two charts
- Direct labels on bars/lines; minimize legend hunting
- Callout boxes for the one number the reader must remember
- Footnote sources on every exhibit; label estimates explicitly
McKinsey's 2020+ template uses Arial for body content and Georgia for titles. Action titles often run 28–32 pt; subheads 18–24 pt. Consistent hierarchy matters more than exact point sizes.
For Excel-linked waterfall and Mekko charts inside PowerPoint, see Think-Cell alternatives.
Copy-ready template: 8-slide main path
Use this interactive outline, then download the PDF template or open it in GenPPT.
Move methodology, survey tabs, and model backups to the appendix. Reference them from footnotes on body slides.
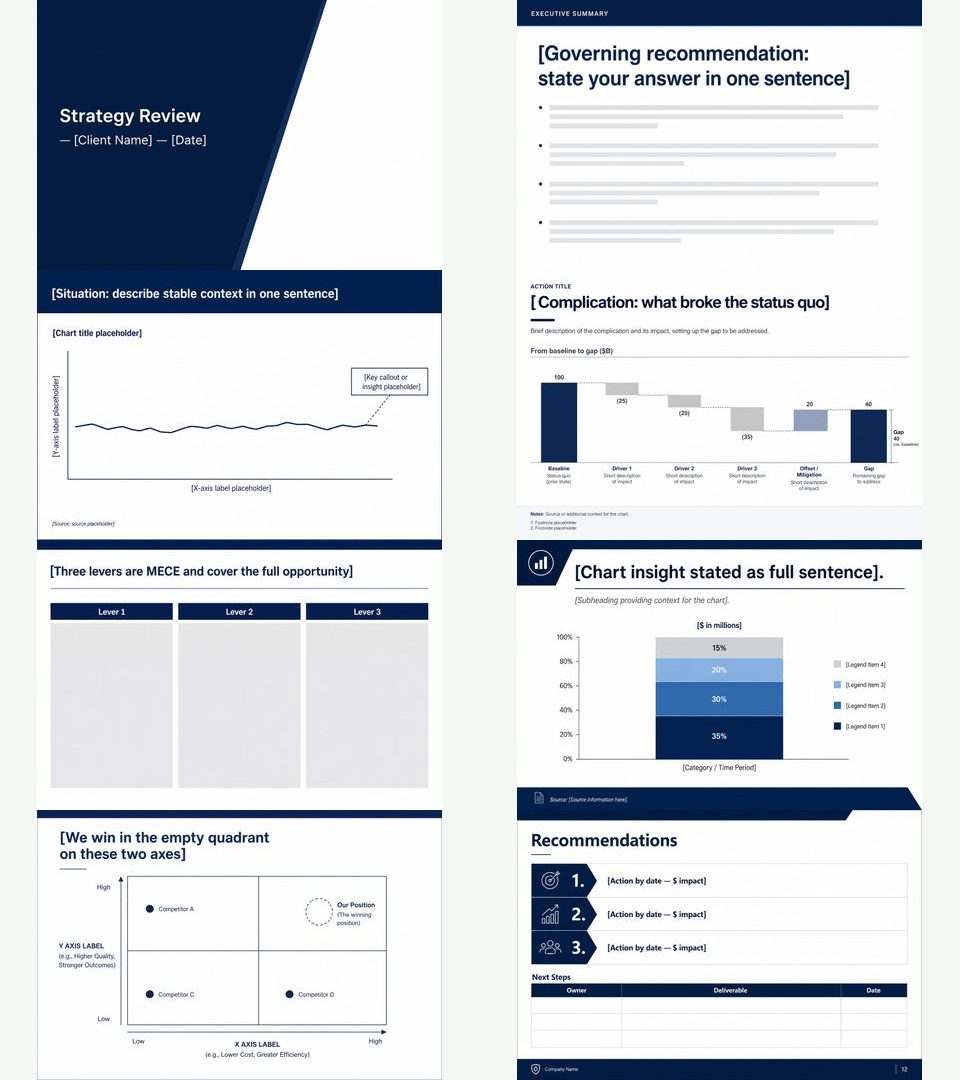
Template slide previews
Our downloadable 8-slide PDF uses this structure. Preview:
Common mistakes (and fixes)
Share the executive summary with key stakeholders before the steering meeting so the session confirms alignment instead of surfacing surprises live.
When McKinsey-style slides are the wrong fit
Use a different structure when:
- You are fundraising. Investor pitches follow problem → market → traction → ask. See our pitch deck hub and the 10-20-30 rule.
- You are teaching. Training decks need step-by-step slides; break the "answer first" rule on purpose.
- You have five minutes. A three-slide exec brief beats a 40-slide consulting pack. Match slide count to your slot with how many slides per minute.
Build with GenPPT
Use the McKinsey slide generator to enter your governing recommendation and generate a deck, or open the consulting deck template to preview slides and download the PDF. GenPPT does not replace Excel-linked Think-Cell charts; it speeds up the ghost deck (action-title outline, full-slide visuals, .pptx export).
- Open the McKinsey slide generator or GenPPT with the prompt at the top of this page
- Approve the outline. Rewrite weak topic titles into action titles before generating visuals
- Upload the template contact sheet as a style reference if you want visual consistency
- Export
.pptx, swap in live charts from Excel or Think-Cell, and read titles-only once before the meeting
For document-heavy inputs, see PDF to PowerPoint with AI.
FAQ
How many slides are in a McKinsey presentation?
Final client readouts often run 20–40 main-path slides plus a 60–120 slide appendix. Public webcasts and MGI summaries can be shorter; the 2024 growth webcast linked above is 18 slides.
What font does McKinsey use?
McKinsey's 2020+ template uses Arial for body content and Georgia for titles. Action titles are typically 28–32 pt. BCG historically used Trebuchet MS. Consistent hierarchy matters more than matching firm fonts.
Can I download real McKinsey slides?
McKinsey's published research and webcasts on public record are downloadable; we link the 2024 webcast PDF above. Internal client decks stay confidential.
Can AI build McKinsey-style slides?
Yes, for structure and first-draft visuals. GenPPT drafts action-title outlines and designed slides from a brief or PDF. Verify numbers and add Excel-linked charts in PowerPoint for board-ready exhibits.